- Norway
- /
- Energy Services
- /
- OB:NOL
Take Care Before Jumping Onto Northern Ocean Ltd. (OB:NOL) Even Though It's 28% Cheaper


Unfortunately for some shareholders, the Northern Ocean Ltd. (OB:NOL) share price has dived 28% in the last thirty days, prolonging recent pain. Instead of being rewarded, shareholders who have already held through the last twelve months are now sitting on a 27% share price drop.
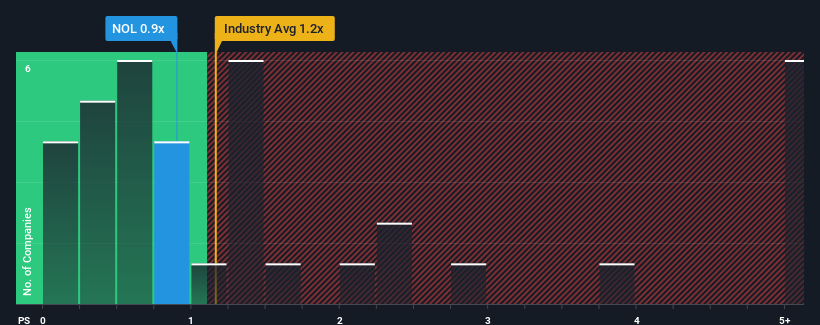
Although its price has dipped substantially, you could still be forgiven for feeling indifferent about Northern Ocean's P/S ratio of 0.9x, since the median price-to-sales (or "P/S") ratio for the Energy Services industry in Norway is also close to 1.2x. While this might not raise any eyebrows, if the P/S ratio is not justified investors could be missing out on a potential opportunity or ignoring looming disappointment.
Check out our latest analysis for Northern Ocean
How Northern Ocean Has Been Performing
Recent times have been advantageous for Northern Ocean as its revenues have been rising faster than most other companies. It might be that many expect the strong revenue performance to wane, which has kept the P/S ratio from rising. If not, then existing shareholders have reason to be feeling optimistic about the future direction of the share price.
Want the full picture on analyst estimates for the company? Then our free report on Northern Ocean will help you uncover what's on the horizon.Do Revenue Forecasts Match The P/S Ratio?
The only time you'd be comfortable seeing a P/S like Northern Ocean's is when the company's growth is tracking the industry closely.
If we review the last year of revenue growth, we see the company's revenues grew exponentially. Pleasingly, revenue has also lifted 109% in aggregate from three years ago, thanks to the last 12 months of explosive growth. Accordingly, shareholders would have definitely welcomed those medium-term rates of revenue growth.
Turning to the outlook, the next three years should generate growth of 27% per year as estimated by the two analysts watching the company. Meanwhile, the rest of the industry is forecast to only expand by 12% per annum, which is noticeably less attractive.
With this in consideration, we find it intriguing that Northern Ocean's P/S is closely matching its industry peers. It may be that most investors aren't convinced the company can achieve future growth expectations.
What Does Northern Ocean's P/S Mean For Investors?
With its share price dropping off a cliff, the P/S for Northern Ocean looks to be in line with the rest of the Energy Services industry. While the price-to-sales ratio shouldn't be the defining factor in whether you buy a stock or not, it's quite a capable barometer of revenue expectations.
We've established that Northern Ocean currently trades on a lower than expected P/S since its forecasted revenue growth is higher than the wider industry. There could be some risks that the market is pricing in, which is preventing the P/S ratio from matching the positive outlook. It appears some are indeed anticipating revenue instability, because these conditions should normally provide a boost to the share price.
Having said that, be aware Northern Ocean is showing 2 warning signs in our investment analysis, you should know about.
If strong companies turning a profit tickle your fancy, then you'll want to check out this free list of interesting companies that trade on a low P/E (but have proven they can grow earnings).
Valuation is complex, but we're here to simplify it.
Discover if Northern Ocean might be undervalued or overvalued with our detailed analysis, featuring fair value estimates, potential risks, dividends, insider trades, and its financial condition.
Access Free AnalysisHave feedback on this article? Concerned about the content? Get in touch with us directly. Alternatively, email editorial-team (at) simplywallst.com.
This article by Simply Wall St is general in nature. We provide commentary based on historical data and analyst forecasts only using an unbiased methodology and our articles are not intended to be financial advice. It does not constitute a recommendation to buy or sell any stock, and does not take account of your objectives, or your financial situation. We aim to bring you long-term focused analysis driven by fundamental data. Note that our analysis may not factor in the latest price-sensitive company announcements or qualitative material. Simply Wall St has no position in any stocks mentioned.
About OB:NOL
Northern Ocean
A drilling contractor, provides offshore contract drilling services for the oil and gas industry worldwide.
Reasonable growth potential and fair value.
Market Insights

Community Narratives

