
Advertisement
- Norway
- /
- Oil and Gas
- /
- OB:HAFNI
Is Weakness In Hafnia Limited (OB:HAFNI) Stock A Sign That The Market Could be Wrong Given Its Strong Financial Prospects?

Hafnia (OB:HAFNI) has had a rough three months with its share price down 7.2%. However, a closer look at its sound financials might cause you to think again. Given that fundamentals usually drive long-term market outcomes, the company is worth looking at. In this article, we decided to focus on Hafnia's ROE.
ROE or return on equity is a useful tool to assess how effectively a company can generate returns on the investment it received from its shareholders. In short, ROE shows the profit each dollar generates with respect to its shareholder investments.
View our latest analysis for Hafnia
How Is ROE Calculated?
ROE can be calculated by using the formula:
Return on Equity = Net Profit (from continuing operations) ÷ Shareholders' Equity
So, based on the above formula, the ROE for Hafnia is:
36% = US$871m ÷ US$2.4b (Based on the trailing twelve months to September 2024).
The 'return' is the profit over the last twelve months. One way to conceptualize this is that for each NOK1 of shareholders' capital it has, the company made NOK0.36 in profit.
What Is The Relationship Between ROE And Earnings Growth?
So far, we've learned that ROE is a measure of a company's profitability. Depending on how much of these profits the company reinvests or "retains", and how effectively it does so, we are then able to assess a company’s earnings growth potential. Assuming everything else remains unchanged, the higher the ROE and profit retention, the higher the growth rate of a company compared to companies that don't necessarily bear these characteristics.
Hafnia's Earnings Growth And 36% ROE
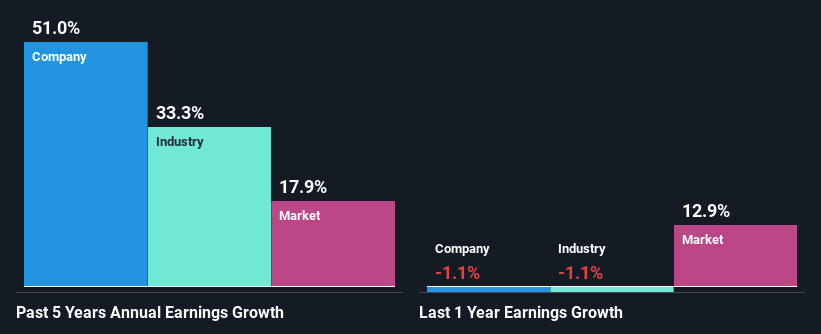
Firstly, we acknowledge that Hafnia has a significantly high ROE. Second, a comparison with the average ROE reported by the industry of 22% also doesn't go unnoticed by us. Under the circumstances, Hafnia's considerable five year net income growth of 51% was to be expected.
Next, on comparing with the industry net income growth, we found that Hafnia's growth is quite high when compared to the industry average growth of 33% in the same period, which is great to see.
Earnings growth is a huge factor in stock valuation. What investors need to determine next is if the expected earnings growth, or the lack of it, is already built into the share price. Doing so will help them establish if the stock's future looks promising or ominous. One good indicator of expected earnings growth is the P/E ratio which determines the price the market is willing to pay for a stock based on its earnings prospects. So, you may want to check if Hafnia is trading on a high P/E or a low P/E, relative to its industry.
Is Hafnia Efficiently Re-investing Its Profits?
Hafnia's significant three-year median payout ratio of 57% (where it is retaining only 43% of its income) suggests that the company has been able to achieve a high growth in earnings despite returning most of its income to shareholders.
Moreover, Hafnia is determined to keep sharing its profits with shareholders which we infer from its long history of five years of paying a dividend. Our latest analyst data shows that the future payout ratio of the company is expected to rise to 89% over the next three years. Accordingly, the expected increase in the payout ratio explains the expected decline in the company's ROE to 17%, over the same period.
Summary
In total, we are pretty happy with Hafnia's performance. We are particularly impressed by the considerable earnings growth posted by the company, which was likely backed by its high ROE. While the company is paying out most of its earnings as dividends, it has been able to grow its earnings in spite of it, so that's probably a good sign. With that said, on studying the latest analyst forecasts, we found that while the company has seen growth in its past earnings, analysts expect its future earnings to shrink. To know more about the latest analysts predictions for the company, check out this visualization of analyst forecasts for the company.
Valuation is complex, but we're here to simplify it.
Discover if Hafnia might be undervalued or overvalued with our detailed analysis, featuring fair value estimates, potential risks, dividends, insider trades, and its financial condition.
Access Free AnalysisHave feedback on this article? Concerned about the content? Get in touch with us directly. Alternatively, email editorial-team (at) simplywallst.com.
This article by Simply Wall St is general in nature. We provide commentary based on historical data and analyst forecasts only using an unbiased methodology and our articles are not intended to be financial advice. It does not constitute a recommendation to buy or sell any stock, and does not take account of your objectives, or your financial situation. We aim to bring you long-term focused analysis driven by fundamental data. Note that our analysis may not factor in the latest price-sensitive company announcements or qualitative material. Simply Wall St has no position in any stocks mentioned.
About OB:HAFNI
Very undervalued with flawless balance sheet and pays a dividend.
Market Insights

Advertisement
Community Narratives
Pinterest will surge as advertising innovations ignite revenue growth
Fair Value US$42.63|27.0% undervalued
BR
Community Contributor
Brambles' Revenue Set to Climb 14% with Profit Margins Following
Fair Value AU$21.90|5.9% overvalued
RO
Community Contributor
Challenging Future for STG as Organic Sales Decline by 8.8%
Fair Value DKK 116.13|26.8% undervalued
KA
Community Contributor