Advertisement
- Norway
- /
- Oil and Gas
- /
- OB:EQNR
Does Equinor’s Recent 3% Rally Signal Opportunity After Market Volatility?

Simply Wall St
Reviewed by Bailey Pemberton
Thinking about what to do with your Equinor stock? You are not alone. Plenty of investors have been weighing their options lately, especially in light of recent share price swings and the fast-changing market backdrop. Over just the past week, Equinor’s stock has edged up by 3.1%. That is a relief after a bumpy ride over the past month, which saw shares slide by 6.0%. On a year-to-date basis, the story has been a bit rough with a 13.1% decline, yet anyone who has held over five years has seen a striking 181.8% return. Clearly, there is more to this story than just the headlines.
Recent developments around renewable energy investments and strategic global partnerships have kept Equinor top of mind for energy investors. These factors serve as both a catalyst for optimism and a source of risk. Such moves not only reframe Equinor’s growth potential but also have an immediate effect on how analysts and the market judge its worth. Amid this shifting environment, our valuation screen puts Equinor at a strong 5 out of 6 on key undervaluation checks, indicating robust potential upside, even if not perfect on every front.
If you are wondering how those numbers were reached, and whether there is more to the story than what meets the eye, let’s break down the major approaches used to value Equinor’s stock. Stick with me until the end, where I will share the insight that often gets missed in standard valuation models.
Why Equinor is lagging behind its peers
Approach 1: Equinor Discounted Cash Flow (DCF) Analysis
A Discounted Cash Flow (DCF) model estimates a company’s intrinsic value by projecting its future cash flows and discounting them back to today’s terms. This approach is widely used for companies like Equinor that generate significant, ongoing cash flows.
For Equinor, the model starts from its recent Free Cash Flow, which stands at $10.17 Billion. Analyst forecasts give visibility up to 2029, with cash flows projected at $6.06 Billion for that year. Beyond 2029, further projections are extrapolated using historical trends and sector dynamics.
The projections show modest annual growth, with a notable dip from present figures but a stable outlook in the following years. All cash flow estimates have been carefully discounted to account for time value and risk to ensure today's fair value calculation is as accurate as possible.
Using this approach, Equinor’s estimated intrinsic value stands at 568.41 NOK per share. This is 57.4% above the current market price, indicating that, based on DCF, Equinor appears significantly undervalued relative to its underlying cash generation potential.
Result: UNDERVALUED
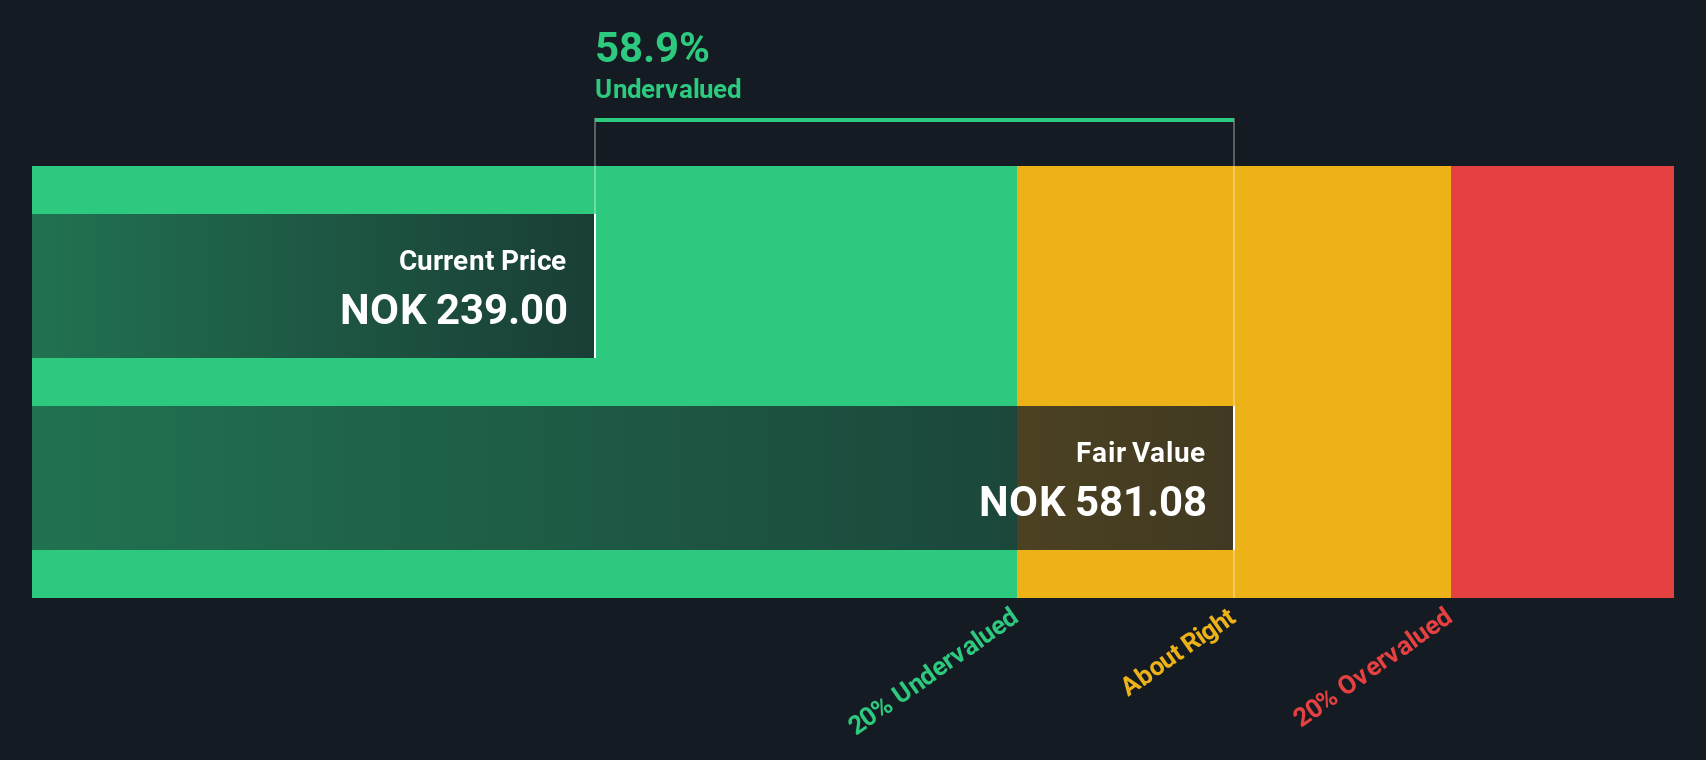
Our Discounted Cash Flow (DCF) analysis suggests Equinor is undervalued by 57.4%. Track this in your watchlist or portfolio, or discover more undervalued stocks.
Approach 2: Equinor Price vs Earnings (PE)
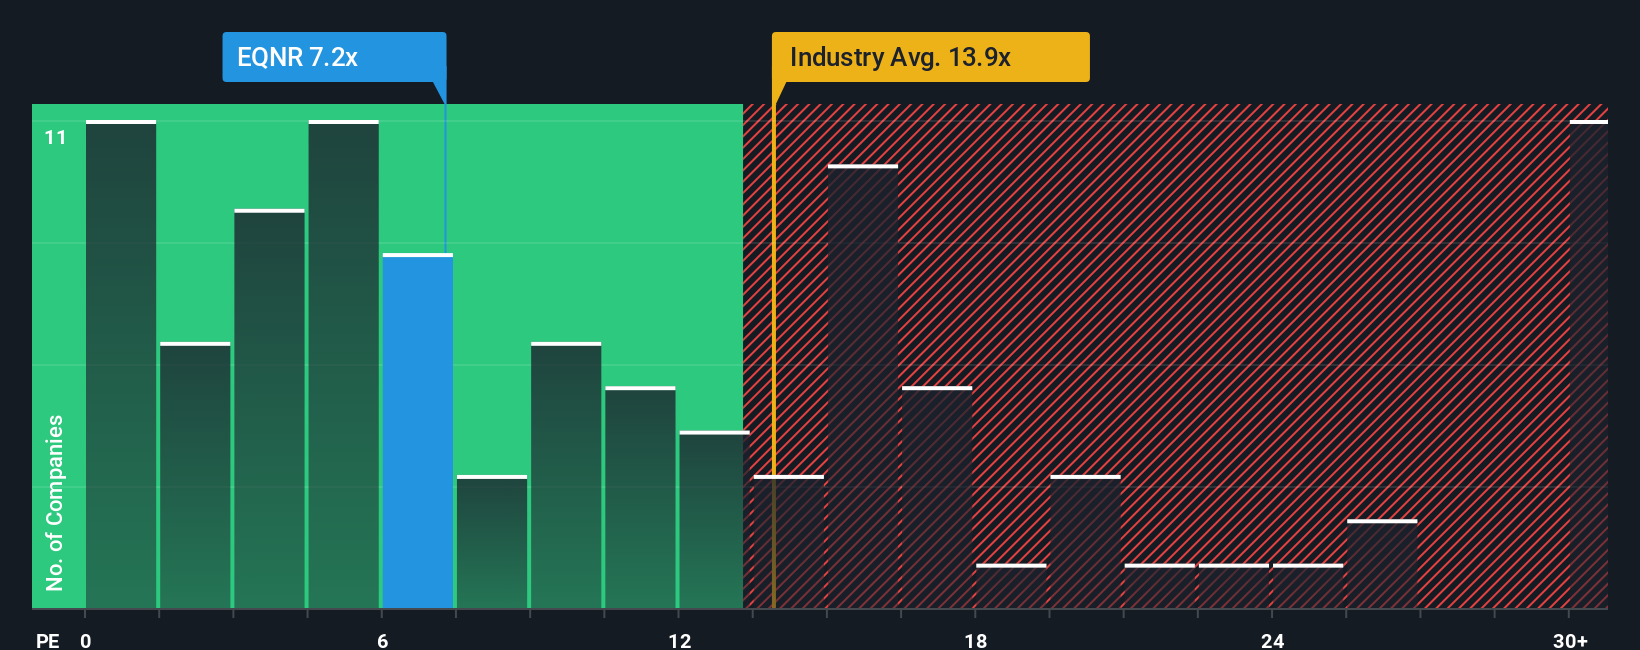
The Price-to-Earnings (PE) ratio is a tried and true method for valuing profitable companies like Equinor. Since it measures a company’s current share price relative to its per-share earnings, it is especially helpful for investors looking to assess how the market is pricing future profit growth.
What counts as a "fair" PE ratio depends on both growth outlook and perceived risk. Companies expected to grow faster or with more predictable earnings typically command higher PE multiples. Those with more uncertainty or lower growth prospects usually see lower ratios, as investors demand a discount for added risk.
Currently, Equinor trades at a PE of 7.42x. For context, peers in the oil and gas sector average a substantially higher 14.33x, and the broader industry sits at 13.07x. At first glance, this might suggest that Equinor is undervalued compared to its peer group and the wider industry. However, Simply Wall St’s proprietary "Fair Ratio" for Equinor is 8.81x. Unlike a broad industry average, the Fair Ratio analyzes factors specific to Equinor, such as its unique earnings growth, risk profile, margins, sector, and company size. This delivers a more tailored benchmark for what constitutes fair value.
With Equinor’s actual 7.42x PE trading below its 8.81x Fair Ratio, the stock appears modestly undervalued when all the relevant company-specific factors are considered.
Result: UNDERVALUED
PE ratios tell one story, but what if the real opportunity lies elsewhere? Discover companies where insiders are betting big on explosive growth.
Upgrade Your Decision Making: Choose your Equinor Narrative
Earlier we mentioned that there is an even better way to understand valuation, so let's introduce you to Narratives. A Narrative is your personal story for a company, connecting what you believe about Equinor’s business outlook, such as its future revenues, profits, and margins, to a financial forecast and, ultimately, a fair value that makes sense to you.
Rather than just relying on formulas or consensus numbers, Narratives help you bridge the gap between the headlines, forecasts, and your own view. They show how your assumptions shape what Equinor is really worth. These Narratives are available right on Simply Wall St’s Community page, a popular hub for millions of investors who want to track, debate, and share their perspectives openly.
With Narratives, deciding when to buy or sell feels more transparent because you can compare your calculated fair value to the current market price and act when there is enough difference to warrant a move. Narratives update automatically when news breaks or new earnings are reported, so your thesis always stays relevant.
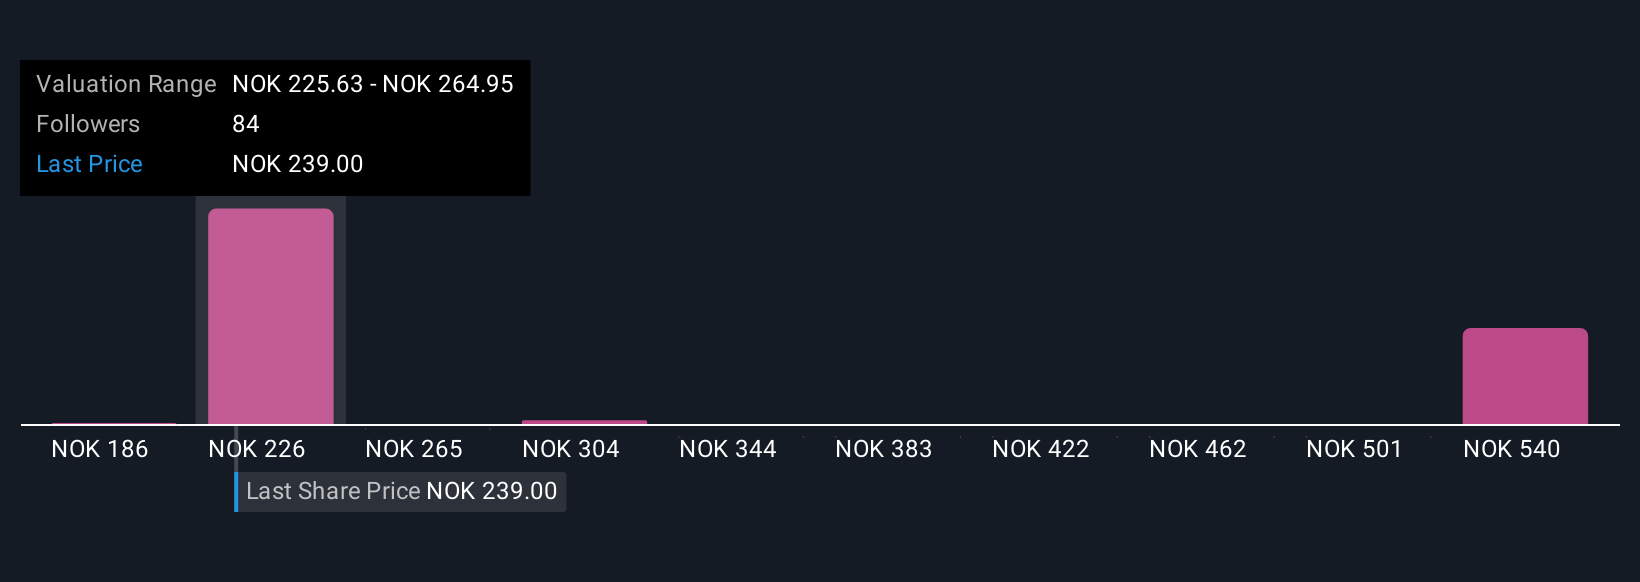
For example, some investors believe Equinor could be worth as much as NOK320.92 per share if new projects exceed expectations, while others see more risk and value it at NOK179.69 amid sector downgrades and lower future returns.
Do you think there's more to the story for Equinor? Create your own Narrative to let the Community know!
This article by Simply Wall St is general in nature. We provide commentary based on historical data and analyst forecasts only using an unbiased methodology and our articles are not intended to be financial advice. It does not constitute a recommendation to buy or sell any stock, and does not take account of your objectives, or your financial situation. We aim to bring you long-term focused analysis driven by fundamental data. Note that our analysis may not factor in the latest price-sensitive company announcements or qualitative material. Simply Wall St has no position in any stocks mentioned.
Valuation is complex, but we're here to simplify it.
Discover if Equinor might be undervalued or overvalued with our detailed analysis, featuring fair value estimates, potential risks, dividends, insider trades, and its financial condition.
Access Free AnalysisHave feedback on this article? Concerned about the content? Get in touch with us directly. Alternatively, email editorial-team@simplywallst.com
About OB:EQNR
Equinor
An energy company, engages in the exploration, production, transportation, refining, and marketing of petroleum and other forms of energy in Norway and internationally.
Undervalued with excellent balance sheet and pays a dividend.
Similar Companies
Market Insights

Advertisement
Community Narratives
The company that turned a verb into a global necessity and basically runs the modern internet, digital ads, smartphones, maps, and AI.
Fair Value US$300.00|10.8% undervalued
OS
Community Contributor
Flowers Foods Pays A Fair Price For Health
Fair Value US$16.12|22.0% undervalued
NV
Community Contributor
TMX Group will thrive with 33.3% profit margin and enduring market moat
Fair Value CA$49.90|3.8% overvalued
LI
Community Contributor