Investors in Tomra Systems (OB:TOM) have unfortunately lost 37% over the last three years


Tomra Systems ASA (OB:TOM) shareholders should be happy to see the share price up 17% in the last quarter. But that doesn't help the fact that the three year return is less impressive. In fact, the share price is down 40% in the last three years, falling well short of the market return.
With that in mind, it's worth seeing if the company's underlying fundamentals have been the driver of long term performance, or if there are some discrepancies.
See our latest analysis for Tomra Systems
While markets are a powerful pricing mechanism, share prices reflect investor sentiment, not just underlying business performance. One way to examine how market sentiment has changed over time is to look at the interaction between a company's share price and its earnings per share (EPS).
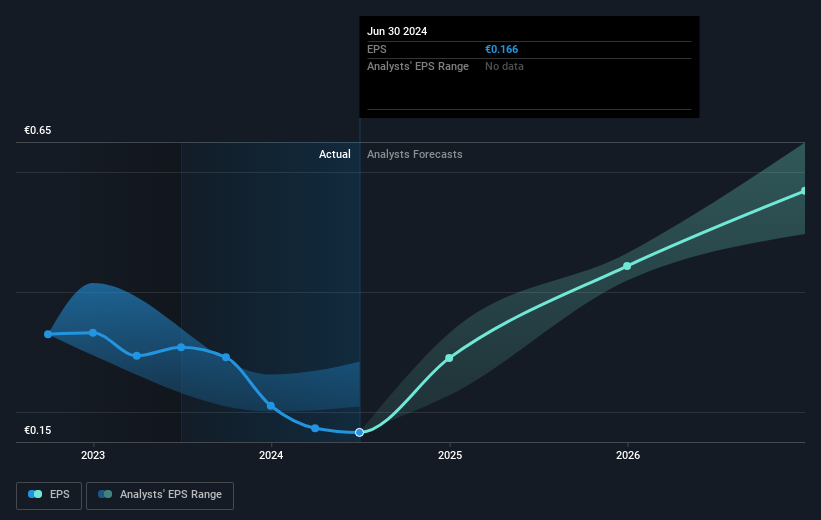
During the three years that the share price fell, Tomra Systems' earnings per share (EPS) dropped by 21% each year. In comparison the 15% compound annual share price decline isn't as bad as the EPS drop-off. So, despite the prior disappointment, shareholders must have some confidence the situation will improve, longer term. With a P/E ratio of 81.72, it's fair to say the market sees a brighter future for the business.
The graphic below depicts how EPS has changed over time (unveil the exact values by clicking on the image).
We like that insiders have been buying shares in the last twelve months. Having said that, most people consider earnings and revenue growth trends to be a more meaningful guide to the business. This free interactive report on Tomra Systems' earnings, revenue and cash flow is a great place to start, if you want to investigate the stock further.
What About Dividends?
It is important to consider the total shareholder return, as well as the share price return, for any given stock. Whereas the share price return only reflects the change in the share price, the TSR includes the value of dividends (assuming they were reinvested) and the benefit of any discounted capital raising or spin-off. Arguably, the TSR gives a more comprehensive picture of the return generated by a stock. As it happens, Tomra Systems' TSR for the last 3 years was -37%, which exceeds the share price return mentioned earlier. And there's no prize for guessing that the dividend payments largely explain the divergence!
A Different Perspective
We're pleased to report that Tomra Systems shareholders have received a total shareholder return of 17% over one year. Of course, that includes the dividend. Since the one-year TSR is better than the five-year TSR (the latter coming in at 6% per year), it would seem that the stock's performance has improved in recent times. Someone with an optimistic perspective could view the recent improvement in TSR as indicating that the business itself is getting better with time. I find it very interesting to look at share price over the long term as a proxy for business performance. But to truly gain insight, we need to consider other information, too. For instance, we've identified 2 warning signs for Tomra Systems that you should be aware of.
There are plenty of other companies that have insiders buying up shares. You probably do not want to miss this free list of undervalued small cap companies that insiders are buying.
Please note, the market returns quoted in this article reflect the market weighted average returns of stocks that currently trade on Norwegian exchanges.
Valuation is complex, but we're here to simplify it.
Discover if Tomra Systems might be undervalued or overvalued with our detailed analysis, featuring fair value estimates, potential risks, dividends, insider trades, and its financial condition.
Access Free AnalysisHave feedback on this article? Concerned about the content? Get in touch with us directly. Alternatively, email editorial-team (at) simplywallst.com.
This article by Simply Wall St is general in nature. We provide commentary based on historical data and analyst forecasts only using an unbiased methodology and our articles are not intended to be financial advice. It does not constitute a recommendation to buy or sell any stock, and does not take account of your objectives, or your financial situation. We aim to bring you long-term focused analysis driven by fundamental data. Note that our analysis may not factor in the latest price-sensitive company announcements or qualitative material. Simply Wall St has no position in any stocks mentioned.
About OB:TOM
Tomra Systems
Provides sensor-based solutions for optimal resource productivity worldwide.
High growth potential with adequate balance sheet.

