
Advertisement

David Iben put it well when he said, 'Volatility is not a risk we care about. What we care about is avoiding the permanent loss of capital.' When we think about how risky a company is, we always like to look at its use of debt, since debt overload can lead to ruin. We can see that Scana ASA (OB:SCANA) does use debt in its business. But the more important question is: how much risk is that debt creating?
Why Does Debt Bring Risk?
Debt is a tool to help businesses grow, but if a business is incapable of paying off its lenders, then it exists at their mercy. If things get really bad, the lenders can take control of the business. While that is not too common, we often do see indebted companies permanently diluting shareholders because lenders force them to raise capital at a distressed price. By replacing dilution, though, debt can be an extremely good tool for businesses that need capital to invest in growth at high rates of return. The first step when considering a company's debt levels is to consider its cash and debt together.
Check out our latest analysis for Scana
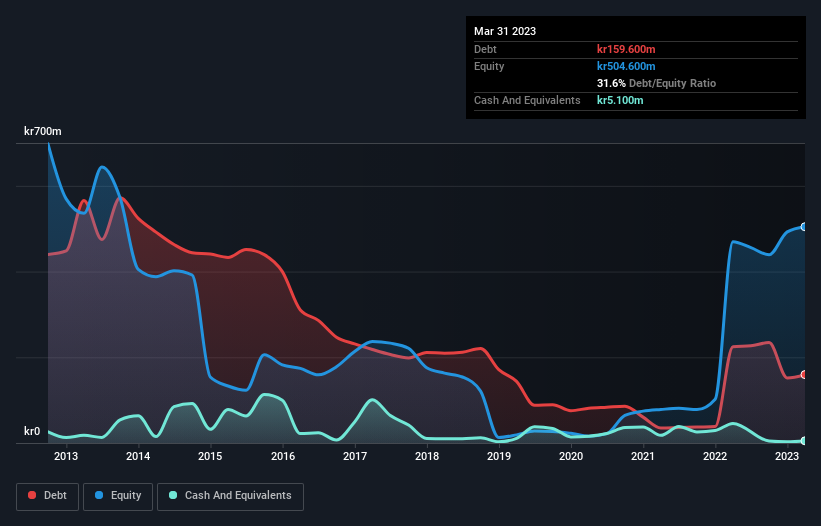
How Much Debt Does Scana Carry?
As you can see below, Scana had kr159.6m of debt at March 2023, down from kr224.7m a year prior. However, it does have kr5.10m in cash offsetting this, leading to net debt of about kr154.5m.
How Healthy Is Scana's Balance Sheet?
The latest balance sheet data shows that Scana had liabilities of kr484.4m due within a year, and liabilities of kr480.5m falling due after that. Offsetting this, it had kr5.10m in cash and kr346.0m in receivables that were due within 12 months. So its liabilities outweigh the sum of its cash and (near-term) receivables by kr613.8m.
This is a mountain of leverage relative to its market capitalization of kr916.4m. Should its lenders demand that it shore up the balance sheet, shareholders would likely face severe dilution. When analysing debt levels, the balance sheet is the obvious place to start. But you can't view debt in total isolation; since Scana will need earnings to service that debt. So when considering debt, it's definitely worth looking at the earnings trend. Click here for an interactive snapshot.
Over 12 months, Scana reported revenue of kr1.1b, which is a gain of 157%, although it did not report any earnings before interest and tax. So there's no doubt that shareholders are cheering for growth
Caveat Emptor
While we can certainly appreciate Scana's revenue growth, its earnings before interest and tax (EBIT) loss is not ideal. Indeed, it lost kr186k at the EBIT level. When we look at that and recall the liabilities on its balance sheet, relative to cash, it seems unwise to us for the company to have any debt. Quite frankly we think the balance sheet is far from match-fit, although it could be improved with time. We would feel better if it turned its trailing twelve month loss of kr20m into a profit. So in short it's a really risky stock. There's no doubt that we learn most about debt from the balance sheet. However, not all investment risk resides within the balance sheet - far from it. Case in point: We've spotted 2 warning signs for Scana you should be aware of.
Of course, if you're the type of investor who prefers buying stocks without the burden of debt, then don't hesitate to discover our exclusive list of net cash growth stocks, today.
New: Manage All Your Stock Portfolios in One Place
We've created the ultimate portfolio companion for stock investors, and it's free.
• Connect an unlimited number of Portfolios and see your total in one currency
• Be alerted to new Warning Signs or Risks via email or mobile
• Track the Fair Value of your stocks
Have feedback on this article? Concerned about the content? Get in touch with us directly. Alternatively, email editorial-team (at) simplywallst.com.
This article by Simply Wall St is general in nature. We provide commentary based on historical data and analyst forecasts only using an unbiased methodology and our articles are not intended to be financial advice. It does not constitute a recommendation to buy or sell any stock, and does not take account of your objectives, or your financial situation. We aim to bring you long-term focused analysis driven by fundamental data. Note that our analysis may not factor in the latest price-sensitive company announcements or qualitative material. Simply Wall St has no position in any stocks mentioned.
About OB:SCANA
Scana
Provides technology and services for the offshore and energy industries in Norway, other European countries, the United States, Asia, and Africa.
Flawless balance sheet and undervalued.
Market Insights

Advertisement
Community Narratives
Groundbreaking therapies that could change the treatment landscape for PTSD, fibromyalgia, MS & Alzheimer’s
Fair Value US$6.20|86.9% undervalued
CM
Community Contributor
DigitalOcean Will Grow 14% by Embracing AI with Paperspace Acquisition
Fair Value US$50.00|42.8% undervalued
NE
Community Contributor
Viant Technology: A Rising AdTech Challenger in the AI-Powered CTV Market
Fair Value US$38.61|66.0% undervalued
BL
Community Contributor
Volvo will Accelerate Forward into Electric and Autonomous Leadership in Five Years
Fair Value SEK 438.80|40.8% undervalued
UN
Community Contributor