- Norway
- /
- Aerospace & Defense
- /
- OB:KOG
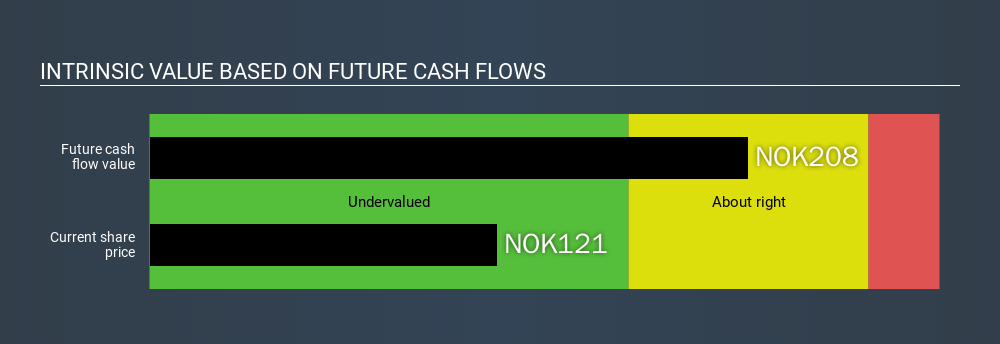
Is There An Opportunity With Kongsberg Gruppen ASA's (OB:KOG) 42% Undervaluation?


Does the March share price for Kongsberg Gruppen ASA (OB:KOG) reflect what it's really worth? Today, we will estimate the stock's intrinsic value by estimating the company's future cash flows and discounting them to their present value. I will use the Discounted Cash Flow (DCF) model. It may sound complicated, but actually it is quite simple!
Companies can be valued in a lot of ways, so we would point out that a DCF is not perfect for every situation. Anyone interested in learning a bit more about intrinsic value should have a read of the Simply Wall St analysis model.
View our latest analysis for Kongsberg Gruppen
Is Kongsberg Gruppen fairly valued?
We're using the 2-stage growth model, which simply means we take in account two stages of company's growth. In the initial period the company may have a higher growth rate and the second stage is usually assumed to have a stable growth rate. To start off with, we need to estimate the next ten years of cash flows. Where possible we use analyst estimates, but when these aren't available we extrapolate the previous free cash flow (FCF) from the last estimate or reported value. We assume companies with shrinking free cash flow will slow their rate of shrinkage, and that companies with growing free cash flow will see their growth rate slow, over this period. We do this to reflect that growth tends to slow more in the early years than it does in later years.
Generally we assume that a dollar today is more valuable than a dollar in the future, so we discount the value of these future cash flows to their estimated value in today's dollars:
10-year free cash flow (FCF) estimate
| 2020 | 2021 | 2022 | 2023 | 2024 | 2025 | 2026 | 2027 | 2028 | 2029 | |
| Levered FCF (NOK, Millions) | kr2.49b | kr2.21b | kr2.18b | kr2.16b | kr2.15b | kr2.15b | kr2.16b | kr2.16b | kr2.17b | kr2.18b |
| Growth Rate Estimate Source | Analyst x3 | Analyst x3 | Analyst x3 | Est @ -0.81% | Est @ -0.37% | Est @ -0.06% | Est @ 0.15% | Est @ 0.3% | Est @ 0.41% | Est @ 0.48% |
| Present Value (NOK, Millions) Discounted @ 6.3% | kr2.3k | kr2.0k | kr1.8k | kr1.7k | kr1.6k | kr1.5k | kr1.4k | kr1.3k | kr1.3k | kr1.2k |
("Est" = FCF growth rate estimated by Simply Wall St)
Present Value of 10-year Cash Flow (PVCF) = kr16b
The second stage is also known as Terminal Value, this is the business's cash flow after the first stage. For a number of reasons a very conservative growth rate is used that cannot exceed that of a country's GDP growth. In this case we have used the 10-year government bond rate (0.6%) to estimate future growth. In the same way as with the 10-year 'growth' period, we discount future cash flows to today's value, using a cost of equity of 6.3%.
Terminal Value (TV)= FCF2029 × (1 + g) ÷ (r – g) = kr2.2b× (1 + 0.6%) ÷ 6.3%– 0.6%) = kr39b
Present Value of Terminal Value (PVTV)= TV / (1 + r)10= kr39b÷ ( 1 + 6.3%)10= kr21b
The total value, or equity value, is then the sum of the present value of the future cash flows, which in this case is kr37b. The last step is to then divide the equity value by the number of shares outstanding. Compared to the current share price of kr121, the company appears quite undervalued at a 42% discount to where the stock price trades currently. The assumptions in any calculation have a big impact on the valuation, so it is better to view this as a rough estimate, not precise down to the last cent.
Important assumptions
The calculation above is very dependent on two assumptions. The first is the discount rate and the other is the cash flows. Part of investing is coming up with your own evaluation of a company's future performance, so try the calculation yourself and check your own assumptions. The DCF also does not consider the possible cyclicality of an industry, or a company's future capital requirements, so it does not give a full picture of a company's potential performance. Given that we are looking at Kongsberg Gruppen as potential shareholders, the cost of equity is used as the discount rate, rather than the cost of capital (or weighted average cost of capital, WACC) which accounts for debt. In this calculation we've used 6.3%, which is based on a levered beta of 1.034. Beta is a measure of a stock's volatility, compared to the market as a whole. We get our beta from the industry average beta of globally comparable companies, with an imposed limit between 0.8 and 2.0, which is a reasonable range for a stable business.
Next Steps:
Whilst important, DCF calculation shouldn’t be the only metric you look at when researching a company. The DCF model is not a perfect stock valuation tool. Rather it should be seen as a guide to "what assumptions need to be true for this stock to be under/overvalued?" If a company grows at a different rate, or if its cost of equity or risk free rate changes sharply, the output can look very different. What is the reason for the share price to differ from the intrinsic value? For Kongsberg Gruppen, We've put together three pertinent factors you should look at:
- Risks: As an example, we've found 3 warning signs for Kongsberg Gruppen that you need to consider before investing here.
- Future Earnings: How does KOG's growth rate compare to its peers and the wider market? Dig deeper into the analyst consensus number for the upcoming years by interacting with our free analyst growth expectation chart.
- Other Solid Businesses: Low debt, high returns on equity and good past performance are fundamental to a strong business. Why not explore our interactive list of stocks with solid business fundamentals to see if there are other companies you may not have considered!
PS. Simply Wall St updates its DCF calculation for every NO stock every day, so if you want to find the intrinsic value of any other stock just search here.
If you spot an error that warrants correction, please contact the editor at editorial-team@simplywallst.com. This article by Simply Wall St is general in nature. It does not constitute a recommendation to buy or sell any stock, and does not take account of your objectives, or your financial situation. Simply Wall St has no position in the stocks mentioned.
We aim to bring you long-term focused research analysis driven by fundamental data. Note that our analysis may not factor in the latest price-sensitive company announcements or qualitative material. Thank you for reading.
About OB:KOG
Kongsberg Gruppen
Provides high-tech systems and solutions primarily to customers in the maritime and defense markets.
Outstanding track record with flawless balance sheet.
Similar Companies
Market Insights

Community Narratives

