Has HAV Group ASA's (OB:HAV) Impressive Stock Performance Got Anything to Do With Its Fundamentals?


HAV Group (OB:HAV) has had a great run on the share market with its stock up by a significant 22% over the last three months. Given that stock prices are usually aligned with a company's financial performance in the long-term, we decided to study its financial indicators more closely to see if they had a hand to play in the recent price move. Specifically, we decided to study HAV Group's ROE in this article.
Return on Equity or ROE is a test of how effectively a company is growing its value and managing investors’ money. Put another way, it reveals the company's success at turning shareholder investments into profits.
See our latest analysis for HAV Group
How Do You Calculate Return On Equity?
Return on equity can be calculated by using the formula:
Return on Equity = Net Profit (from continuing operations) ÷ Shareholders' Equity
So, based on the above formula, the ROE for HAV Group is:
5.9% = kr7.3m ÷ kr124m (Based on the trailing twelve months to September 2023).
The 'return' is the income the business earned over the last year. One way to conceptualize this is that for each NOK1 of shareholders' capital it has, the company made NOK0.06 in profit.
Why Is ROE Important For Earnings Growth?
So far, we've learned that ROE is a measure of a company's profitability. Depending on how much of these profits the company reinvests or "retains", and how effectively it does so, we are then able to assess a company’s earnings growth potential. Assuming all else is equal, companies that have both a higher return on equity and higher profit retention are usually the ones that have a higher growth rate when compared to companies that don't have the same features.
HAV Group's Earnings Growth And 5.9% ROE
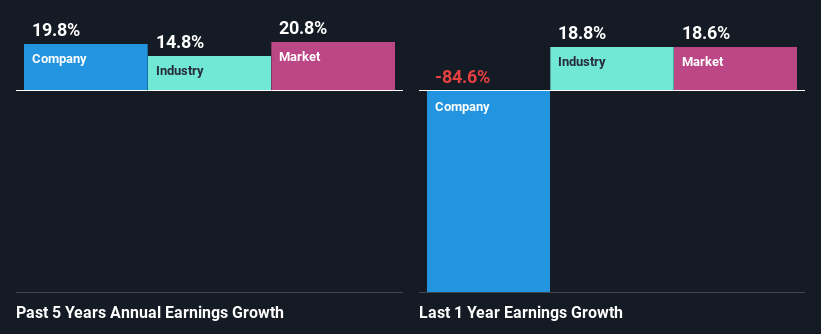
On the face of it, HAV Group's ROE is not much to talk about. Next, when compared to the average industry ROE of 12%, the company's ROE leaves us feeling even less enthusiastic. HAV Group was still able to see a decent net income growth of 20% over the past five years. We reckon that there could be other factors at play here. For instance, the company has a low payout ratio or is being managed efficiently.
As a next step, we compared HAV Group's net income growth with the industry, and pleasingly, we found that the growth seen by the company is higher than the average industry growth of 15%.
Earnings growth is a huge factor in stock valuation. What investors need to determine next is if the expected earnings growth, or the lack of it, is already built into the share price. By doing so, they will have an idea if the stock is headed into clear blue waters or if swampy waters await. Is HAV Group fairly valued compared to other companies? These 3 valuation measures might help you decide.
Is HAV Group Using Its Retained Earnings Effectively?
HAV Group doesn't pay any dividend, meaning that all of its profits are being reinvested in the business, which explains the fair bit of earnings growth the company has seen.
Conclusion
On the whole, we do feel that HAV Group has some positive attributes. Despite its low rate of return, the fact that the company reinvests a very high portion of its profits into its business, no doubt contributed to its high earnings growth. Having said that, looking at the current analyst estimates, we found that the company's earnings are expected to gain momentum. To know more about the company's future earnings growth forecasts take a look at this free report on analyst forecasts for the company to find out more.
Valuation is complex, but we're here to simplify it.
Discover if HAV Group might be undervalued or overvalued with our detailed analysis, featuring fair value estimates, potential risks, dividends, insider trades, and its financial condition.
Access Free AnalysisHave feedback on this article? Concerned about the content? Get in touch with us directly. Alternatively, email editorial-team (at) simplywallst.com.
This article by Simply Wall St is general in nature. We provide commentary based on historical data and analyst forecasts only using an unbiased methodology and our articles are not intended to be financial advice. It does not constitute a recommendation to buy or sell any stock, and does not take account of your objectives, or your financial situation. We aim to bring you long-term focused analysis driven by fundamental data. Note that our analysis may not factor in the latest price-sensitive company announcements or qualitative material. Simply Wall St has no position in any stocks mentioned.
About OB:HAV
HAV Group
Through its subsidiaries, provides technology and services for maritime and marine industries worldwide.
Slightly overvalued with imperfect balance sheet.

