Did You Participate In Any Of SpareBank 1 SR-Bank's (OB:SRBNK) Fantastic 172% Return ?


The worst result, after buying shares in a company (assuming no leverage), would be if you lose all the money you put in. But on the bright side, you can make far more than 100% on a really good stock. For instance, the price of SpareBank 1 SR-Bank ASA (OB:SRBNK) stock is up an impressive 130% over the last five years. On top of that, the share price is up 18% in about a quarter. But this move may well have been assisted by the reasonably buoyant market (up 13% in 90 days).
View our latest analysis for SpareBank 1 SR-Bank
To paraphrase Benjamin Graham: Over the short term the market is a voting machine, but over the long term it's a weighing machine. One imperfect but simple way to consider how the market perception of a company has shifted is to compare the change in the earnings per share (EPS) with the share price movement.
During five years of share price growth, SpareBank 1 SR-Bank actually saw its EPS drop 3.5% per year.
So it's hard to argue that the earnings per share are the best metric to judge the company, as it may not be optimized for profits at this point. Since the change in EPS doesn't seem to correlate with the change in share price, it's worth taking a look at other metrics.
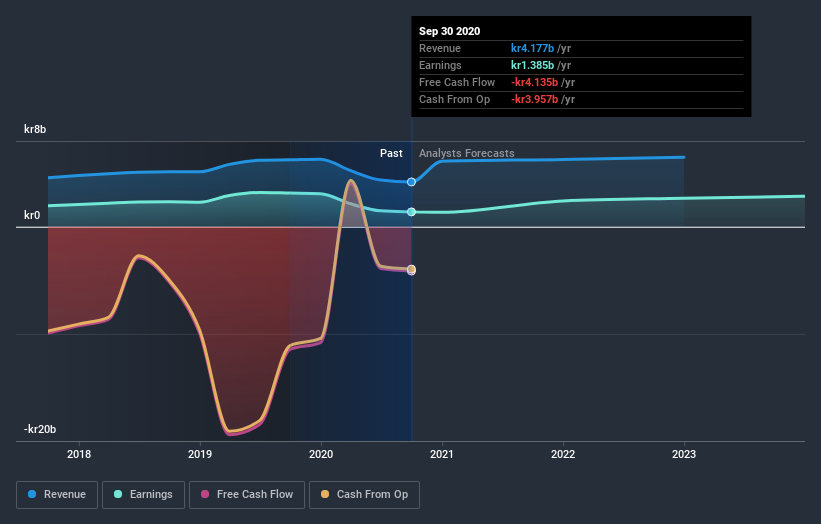
In contrast revenue growth of 7.0% per year is probably viewed as evidence that SpareBank 1 SR-Bank is growing, a real positive. It's quite possible that management are prioritizing revenue growth over EPS growth at the moment.
The company's revenue and earnings (over time) are depicted in the image below (click to see the exact numbers).
If you are thinking of buying or selling SpareBank 1 SR-Bank stock, you should check out this FREE detailed report on its balance sheet.
What about the Total Shareholder Return (TSR)?
Investors should note that there's a difference between SpareBank 1 SR-Bank's total shareholder return (TSR) and its share price change, which we've covered above. Arguably the TSR is a more complete return calculation because it accounts for the value of dividends (as if they were reinvested), along with the hypothetical value of any discounted capital that have been offered to shareholders. Its history of dividend payouts mean that SpareBank 1 SR-Bank's TSR of 172% over the last 5 years is better than the share price return.
A Different Perspective
While the broader market gained around 0.7% in the last year, SpareBank 1 SR-Bank shareholders lost 9.0%. Even the share prices of good stocks drop sometimes, but we want to see improvements in the fundamental metrics of a business, before getting too interested. On the bright side, long term shareholders have made money, with a gain of 22% per year over half a decade. It could be that the recent sell-off is an opportunity, so it may be worth checking the fundamental data for signs of a long term growth trend. It's always interesting to track share price performance over the longer term. But to understand SpareBank 1 SR-Bank better, we need to consider many other factors. Even so, be aware that SpareBank 1 SR-Bank is showing 1 warning sign in our investment analysis , you should know about...
If you like to buy stocks alongside management, then you might just love this free list of companies. (Hint: insiders have been buying them).
Please note, the market returns quoted in this article reflect the market weighted average returns of stocks that currently trade on NO exchanges.
When trading SpareBank 1 SR-Bank or any other investment, use the platform considered by many to be the Professional's Gateway to the Worlds Market, Interactive Brokers. You get the lowest-cost* trading on stocks, options, futures, forex, bonds and funds worldwide from a single integrated account. Promoted
New: Manage All Your Stock Portfolios in One Place
We've created the ultimate portfolio companion for stock investors, and it's free.
• Connect an unlimited number of Portfolios and see your total in one currency
• Be alerted to new Warning Signs or Risks via email or mobile
• Track the Fair Value of your stocks
This article by Simply Wall St is general in nature. It does not constitute a recommendation to buy or sell any stock, and does not take account of your objectives, or your financial situation. We aim to bring you long-term focused analysis driven by fundamental data. Note that our analysis may not factor in the latest price-sensitive company announcements or qualitative material. Simply Wall St has no position in any stocks mentioned.
*Interactive Brokers Rated Lowest Cost Broker by StockBrokers.com Annual Online Review 2020
Have feedback on this article? Concerned about the content? Get in touch with us directly. Alternatively, email editorial-team (at) simplywallst.com.
About OB:SB1NO
SpareBank 1 Sør-Norge
Provides various financial products and services for personal and corporate customers primarily in Rogaland, Agder, Vestland, Oslo, and Viken.
Undervalued with solid track record and pays a dividend.

