
Advertisement
- Netherlands
- /
- Semiconductors
- /
- ENXTAM:ASML
What Is ASML Holding's (AMS:ASML) P/E Ratio After Its Share Price Tanked?
To the annoyance of some shareholders, ASML Holding (AMS:ASML) shares are down a considerable 36% in the last month. Looking back over the last year, the stock has been a solid performer, with a gain of 12%.
Assuming nothing else has changed, a lower share price makes a stock more attractive to potential buyers. While the market sentiment towards a stock is very changeable, in the long run, the share price will tend to move in the same direction as earnings per share. So, on certain occasions, long term focussed investors try to take advantage of pessimistic expectations to buy shares at a better price. One way to gauge market expectations of a stock is to look at its Price to Earnings Ratio (PE Ratio). A high P/E implies that investors have high expectations of what a company can achieve compared to a company with a low P/E ratio.
View our latest analysis for ASML Holding
How Does ASML Holding's P/E Ratio Compare To Its Peers?
We can tell from its P/E ratio of 30.18 that there is some investor optimism about ASML Holding. You can see in the image below that the average P/E (19.3) for companies in the semiconductor industry is lower than ASML Holding's P/E.
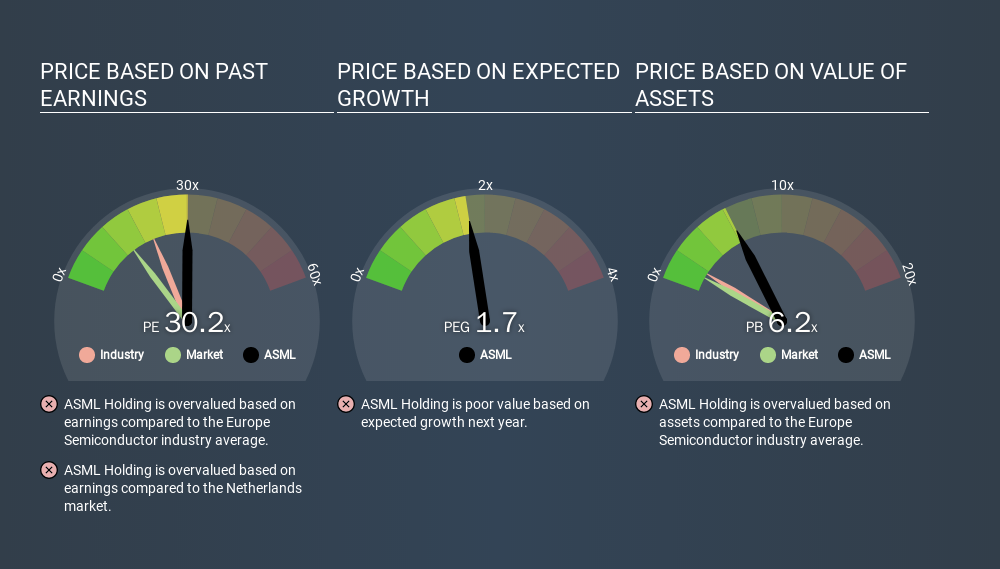
ASML Holding's P/E tells us that market participants think the company will perform better than its industry peers, going forward. The market is optimistic about the future, but that doesn't guarantee future growth. So further research is always essential. I often monitor director buying and selling.
How Growth Rates Impact P/E Ratios
Earnings growth rates have a big influence on P/E ratios. That's because companies that grow earnings per share quickly will rapidly increase the 'E' in the equation. Therefore, even if you pay a high multiple of earnings now, that multiple will become lower in the future. Then, a lower P/E should attract more buyers, pushing the share price up.
ASML Holding maintained roughly steady earnings over the last twelve months. But EPS is up 14% over the last 5 years.
A Limitation: P/E Ratios Ignore Debt and Cash In The Bank
One drawback of using a P/E ratio is that it considers market capitalization, but not the balance sheet. That means it doesn't take debt or cash into account. Hypothetically, a company could reduce its future P/E ratio by spending its cash (or taking on debt) to achieve higher earnings.
While growth expenditure doesn't always pay off, the point is that it is a good option to have; but one that the P/E ratio ignores.
Is Debt Impacting ASML Holding's P/E?
Since ASML Holding holds net cash of €1.6b, it can spend on growth, justifying a higher P/E ratio than otherwise.
The Bottom Line On ASML Holding's P/E Ratio
ASML Holding's P/E is 30.2 which is above average (13.6) in its market. EPS was up modestly better over the last twelve months. And the healthy balance sheet means the company can sustain growth while the P/E suggests shareholders think it will. What can be absolutely certain is that the market has become significantly less optimistic about ASML Holding over the last month, with the P/E ratio falling from 46.8 back then to 30.2 today. For those who prefer to invest with the flow of momentum, that might be a bad sign, but for a contrarian, it may signal opportunity.
Investors should be looking to buy stocks that the market is wrong about. If the reality for a company is better than it expects, you can make money by buying and holding for the long term. So this free visual report on analyst forecasts could hold the key to an excellent investment decision.
Of course you might be able to find a better stock than ASML Holding. So you may wish to see this free collection of other companies that have grown earnings strongly.
If you spot an error that warrants correction, please contact the editor at editorial-team@simplywallst.com. This article by Simply Wall St is general in nature. It does not constitute a recommendation to buy or sell any stock, and does not take account of your objectives, or your financial situation. Simply Wall St has no position in the stocks mentioned.
We aim to bring you long-term focused research analysis driven by fundamental data. Note that our analysis may not factor in the latest price-sensitive company announcements or qualitative material. Thank you for reading.
About ENXTAM:ASML
ASML Holding
Provides lithography solutions for the development, production, marketing, sales, upgrading, and servicing of advanced semiconductor equipment systems.
Outstanding track record with flawless balance sheet.
Similar Companies
Market Insights

Advertisement
Weekly Picks
RO


RockeTeller on Santacruz Silver Mining ·
Crazy Undervalued 42 Baggers Silver Play (Active & Running Mine)
Fair Value:CA$8696.7% undervalued
31 followersusers have followed this narrative
6 commentsusers have commented on this narrative
8 likesusers have liked this narrative
RO


Robbo on Fiducian Group ·
Fiducian: Compliance Clouds or Value Opportunity?
Fair Value:AU$126.1% undervalued
4 followersusers have followed this narrative
0 commentsusers have commented on this narrative
0 likesusers have liked this narrative
WO

woodworthfund on Willamette Valley Vineyards ·
Willamette Valley Vineyards (WVVI): Not-So-Great Value
Fair Value:US$242.5% overvalued
6 followersusers have followed this narrative
0 commentsusers have commented on this narrative
1 likeusers have liked this narrative
Recently Updated Narratives
MA


MarkoVT on Alphabet ·
Positioned globally, partnered locally
Fair Value:US$390.1919.1% undervalued
1 followerusers have followed this narrative
0 commentsusers have commented on this narrative
0 likesusers have liked this narrative
JO


JohnJ on Worldline ·
When will fraudsters be investigated in depth. Fraud was ongoing in France too.
Fair Value:€0.5190.0% overvalued
1 followerusers have followed this narrative
0 commentsusers have commented on this narrative
0 likesusers have liked this narrative
MA

MarkoVT on Applied Digital ·
Staggered by dilution; positions for growth
Fair Value:US$35.4520.9% undervalued
5 followersusers have followed this narrative
0 commentsusers have commented on this narrative
0 likesusers have liked this narrative
Popular Narratives
TH


TheWallstreetKing on MicroVision ·
MicroVision will explode future revenue by 380.37% with a vision towards success
Fair Value:US$6098.6% undervalued
112 followersusers have followed this narrative
11 commentsusers have commented on this narrative
22 likesusers have liked this narrative
AN


AnalystConsensusTarget on NVIDIA ·
NVDA: Expanding AI Demand Will Drive Major Data Center Investments Through 2026
Fair Value:US$250.3927.5% undervalued
949 followersusers have followed this narrative
6 commentsusers have commented on this narrative
25 likesusers have liked this narrative
OS

oscargarcia on Alphabet ·
The company that turned a verb into a global necessity and basically runs the modern internet, digital ads, smartphones, maps, and AI.
Fair Value:US$3407.1% undervalued
148 followersusers have followed this narrative
6 commentsusers have commented on this narrative
18 likesusers have liked this narrative

