
Advertisement

As European markets face downward pressure amid global uncertainties and geopolitical tensions, investors are increasingly seeking stability through dividend stocks. In this environment, selecting companies with strong fundamentals and consistent dividend payouts can offer a reliable income stream while navigating the complexities of the current economic landscape.
Top 10 Dividend Stocks In Europe
| Name | Dividend Yield | Dividend Rating |
| Zurich Insurance Group (SWX:ZURN) | 4.50% | ★★★★★★ |
| St. Galler Kantonalbank (SWX:SGKN) | 3.97% | ★★★★★★ |
| Rubis (ENXTPA:RUI) | 7.52% | ★★★★★★ |
| OVB Holding (XTRA:O4B) | 4.50% | ★★★★★★ |
| Julius Bär Gruppe (SWX:BAER) | 4.98% | ★★★★★★ |
| Holcim (SWX:HOLN) | 5.35% | ★★★★★★ |
| HEXPOL (OM:HPOL B) | 4.78% | ★★★★★★ |
| Bredband2 i Skandinavien (OM:BRE2) | 4.20% | ★★★★★★ |
| Banque Cantonale Vaudoise (SWX:BCVN) | 4.83% | ★★★★★★ |
| Allianz (XTRA:ALV) | 4.52% | ★★★★★★ |
Click here to see the full list of 237 stocks from our Top European Dividend Stocks screener.
Let's explore several standout options from the results in the screener.
Hydratec Industries (ENXTAM:HYDRA)
Simply Wall St Dividend Rating: ★★★★★☆
Overview: Hydratec Industries NV, with a market cap of €218.37 million, operates through its subsidiaries to manufacture and sell industrial systems and plastic components for the food, health, and mobility markets across the Netherlands and internationally in Europe, Asia, North America, South America, Africa, and Oceania.
Operations: Hydratec Industries NV generates revenue from two main segments: Industrial Systems, which contributes €155.27 million, and High-Tech Components, contributing €115.59 million.
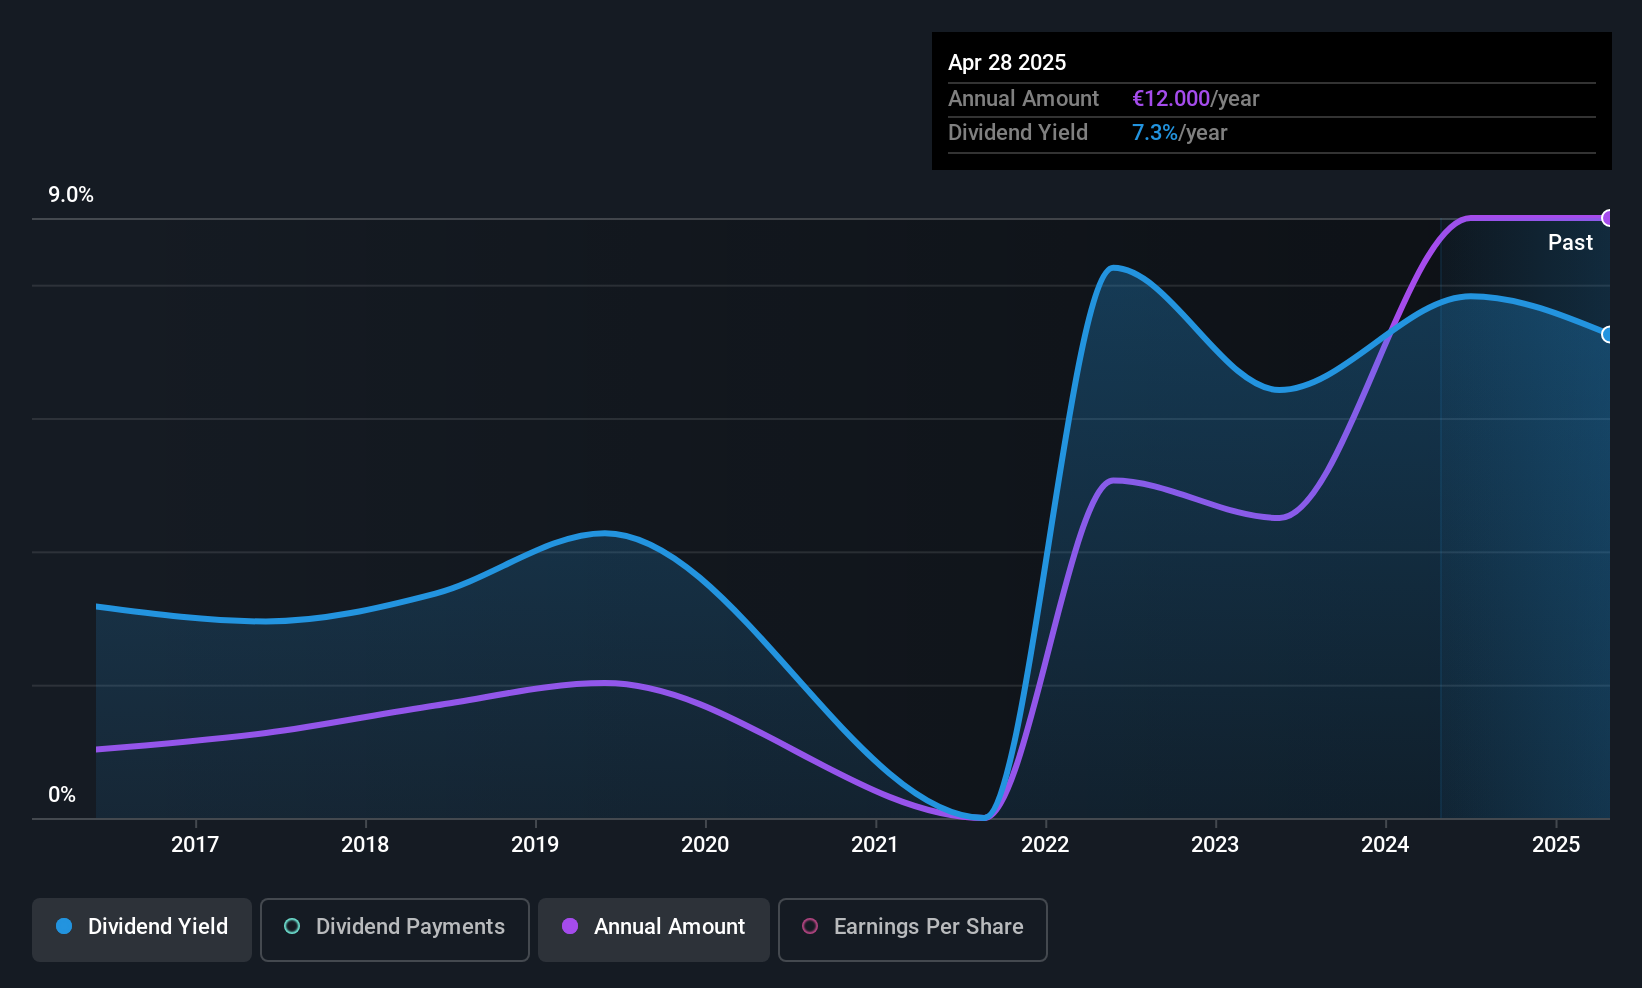
Dividend Yield: 7.1%
Hydratec Industries recently affirmed an annual dividend of €6.00 per share, positioning its yield in the top 25% of Dutch dividend payers. The payout ratio stands at 85.5%, indicating coverage by earnings and a cash payout ratio of 50.8%, suggesting sustainability from cash flows. However, its dividend history is marked by volatility over the past decade despite recent growth in payments and a significant undervaluation compared to estimated fair value.
- Navigate through the intricacies of Hydratec Industries with our comprehensive dividend report here.
- According our valuation report, there's an indication that Hydratec Industries' share price might be on the cheaper side.
Firefly (OM:FIRE)
Simply Wall St Dividend Rating: ★★★★☆☆
Overview: Firefly AB (publ) develops and sells industrial fire prevention and protection systems for the process industry worldwide, with a market cap of SEK1.10 billion.
Operations: Firefly AB (publ) generates revenue through its development and sale of fire prevention and protection systems for the global process industry.
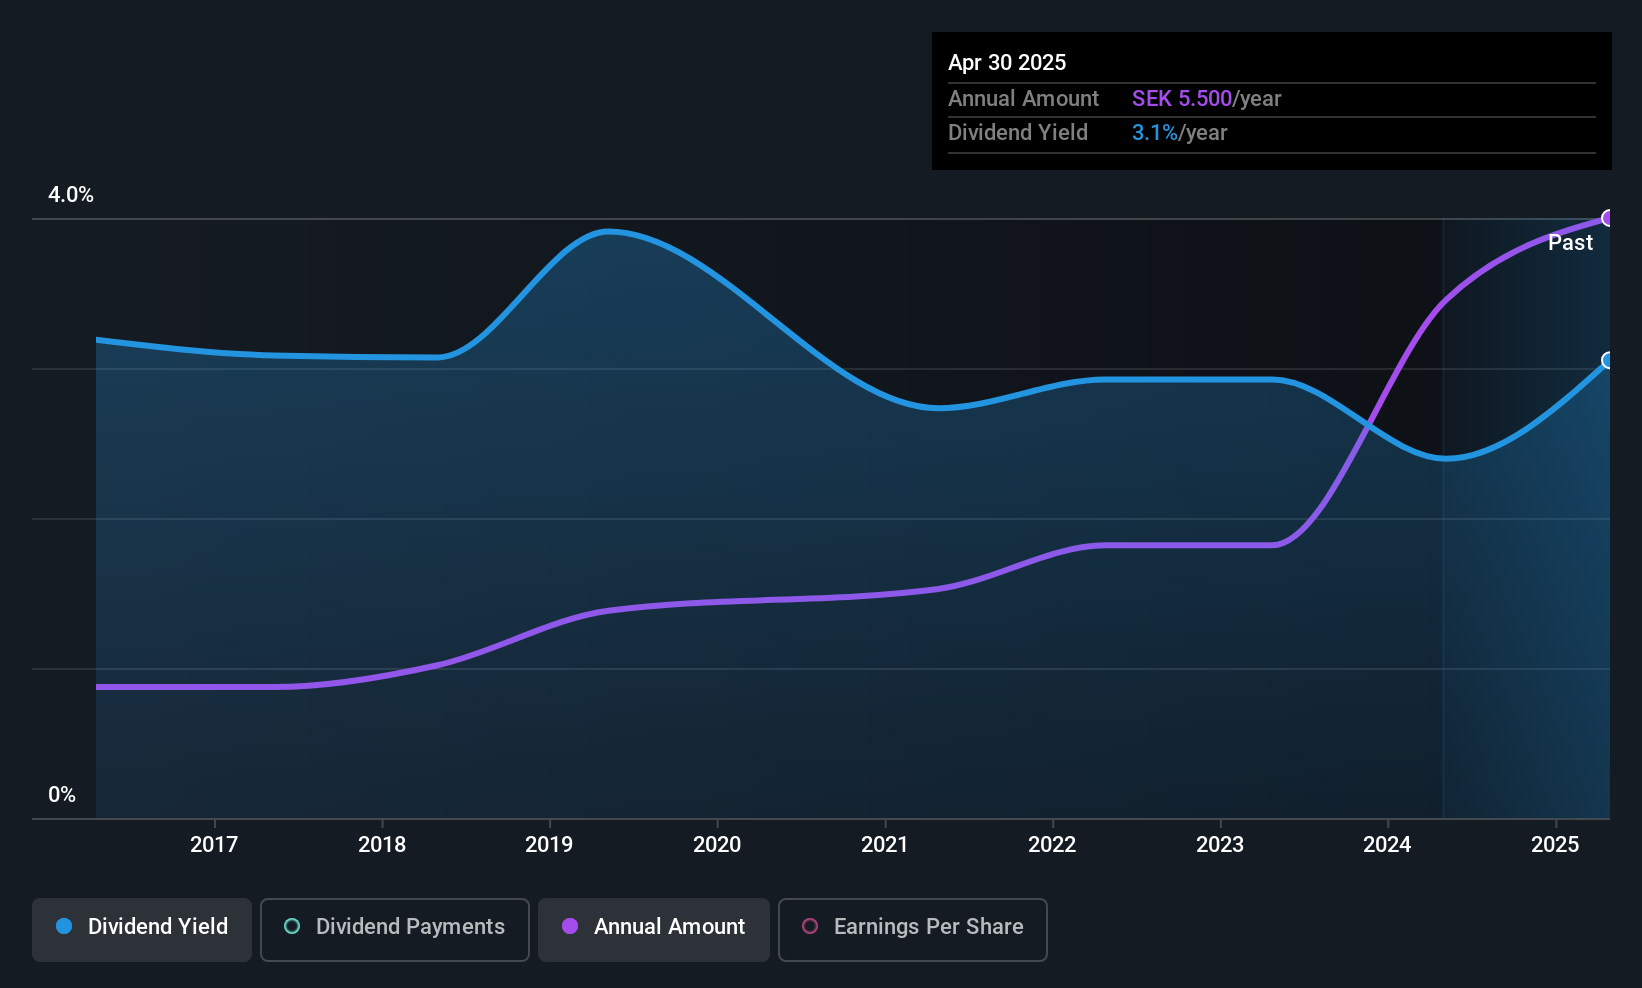
Dividend Yield: 3%
Firefly's dividend payments have been volatile over the past decade, despite recent increases. The payout ratio of 59.9% suggests dividends are covered by earnings, while a cash payout ratio of 85.3% indicates coverage by cash flows. Trading at 14.7% below estimated fair value, Firefly offers a dividend yield of 3.01%, which is lower than the top quartile in Sweden. Recent earnings show modest growth with Q1 sales at SEK 123.36 million and net income at SEK 13.4 million.
- Get an in-depth perspective on Firefly's performance by reading our dividend report here.
- Our expertly prepared valuation report Firefly implies its share price may be lower than expected.
Powszechna Kasa Oszczednosci Bank Polski Spólka Akcyjna (WSE:PKO)
Simply Wall St Dividend Rating: ★★★★☆☆
Overview: Powszechna Kasa Oszczednosci Bank Polski Spólka Akcyjna offers a range of banking products and services both in Poland and internationally, with a market cap of PLN90.88 billion.
Operations: Powszechna Kasa Oszczednosci Bank Polski Spólka Akcyjna generates revenue primarily from its Retail Segment, which accounts for PLN21.36 billion, and its Corporate and Investment Segment, contributing PLN7.87 billion.
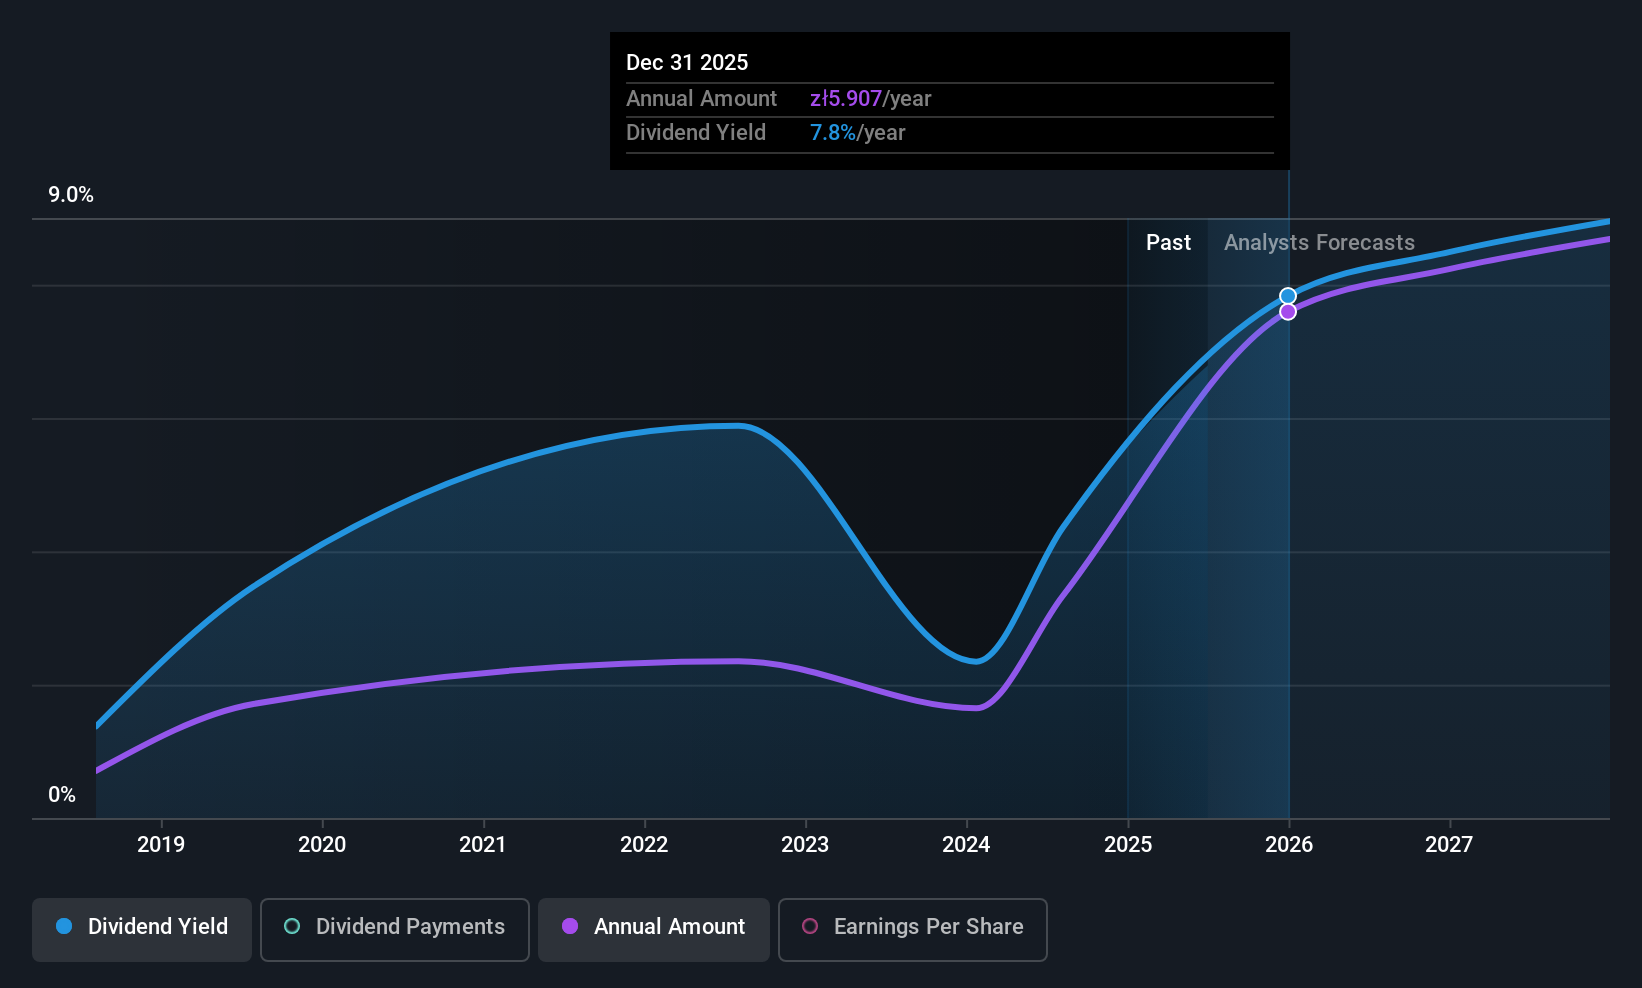
Dividend Yield: 3.6%
Powszechna Kasa Oszczednosci Bank Polski Spólka Akcyjna's dividend payments have been volatile over the past decade, though they have seen growth. The payout ratio of 33.3% indicates dividends are well covered by earnings, with future coverage expected to remain sustainable. The bank's recent Q1 net income rose to PLN 2.47 billion from PLN 2.04 billion a year ago, showing strong earnings growth despite challenges like high bad loans at 3.8%.
- Click here and access our complete dividend analysis report to understand the dynamics of Powszechna Kasa Oszczednosci Bank Polski Spólka Akcyjna.
- Upon reviewing our latest valuation report, Powszechna Kasa Oszczednosci Bank Polski Spólka Akcyjna's share price might be too pessimistic.
Turning Ideas Into Actions
- Unlock more gems! Our Top European Dividend Stocks screener has unearthed 234 more companies for you to explore.Click here to unveil our expertly curated list of 237 Top European Dividend Stocks.
- Got skin in the game with these stocks? Elevate how you manage them by using Simply Wall St's portfolio, where intuitive tools await to help optimize your investment outcomes.
- Streamline your investment strategy with Simply Wall St's app for free and benefit from extensive research on stocks across all corners of the world.
Interested In Other Possibilities?
- Explore high-performing small cap companies that haven't yet garnered significant analyst attention.
- Fuel your portfolio with companies showing strong growth potential, backed by optimistic outlooks both from analysts and management.
- Find companies with promising cash flow potential yet trading below their fair value.
This article by Simply Wall St is general in nature. We provide commentary based on historical data and analyst forecasts only using an unbiased methodology and our articles are not intended to be financial advice. It does not constitute a recommendation to buy or sell any stock, and does not take account of your objectives, or your financial situation. We aim to bring you long-term focused analysis driven by fundamental data. Note that our analysis may not factor in the latest price-sensitive company announcements or qualitative material. Simply Wall St has no position in any stocks mentioned.
New: Manage All Your Stock Portfolios in One Place
We've created the ultimate portfolio companion for stock investors, and it's free.
• Connect an unlimited number of Portfolios and see your total in one currency
• Be alerted to new Warning Signs or Risks via email or mobile
• Track the Fair Value of your stocks
Have feedback on this article? Concerned about the content? Get in touch with us directly. Alternatively, email editorial-team@simplywallst.com
About WSE:PKO
Powszechna Kasa Oszczednosci Bank Polski Spólka Akcyjna
Provides various banking products and services in Poland and internationally.
Proven track record with adequate balance sheet and pays a dividend.
Similar Companies
Market Insights


Advertisement
Community Narratives
Suncorp’s Next Chapter: Insurance-Only and Ready to Grow
Fair Value AU$22.83|5.7% undervalued
RO
Community Contributor
Thyssenkrupp Nucera Will Achieve Double-Digit Profits by 2030 Boosted by Hydrogen Growth
Fair Value €14.40|31.6% undervalued
CH
Community Contributor
Tesla’s Nvidia Moment – The AI & Robotics Inflection Point
Fair Value US$384.84|21.9% undervalued
BL
Community Contributor