
Advertisement
- Netherlands
- /
- Metals and Mining
- /
- ENXTAM:APAM
Market Still Lacking Some Conviction On Aperam S.A. (AMS:APAM)
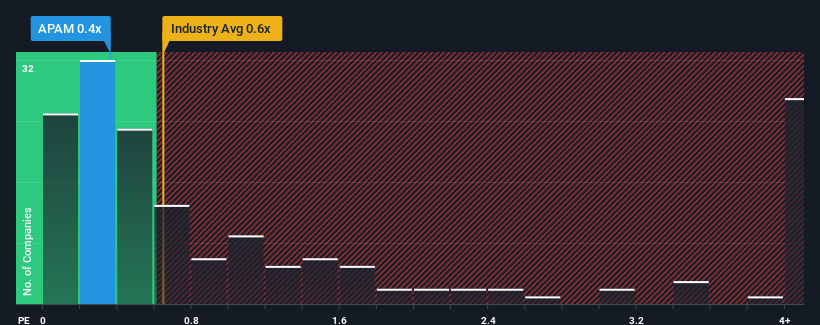
There wouldn't be many who think Aperam S.A.'s (AMS:APAM) price-to-sales (or "P/S") ratio of 0.4x is worth a mention when the median P/S for the Metals and Mining industry in the Netherlands is similar at about 0.6x. However, investors might be overlooking a clear opportunity or potential setback if there is no rational basis for the P/S.
View our latest analysis for Aperam
How Aperam Has Been Performing
With revenue that's retreating more than the industry's average of late, Aperam has been very sluggish. It might be that many expect the dismal revenue performance to revert back to industry averages soon, which has kept the P/S from falling. If you still like the company, you'd want its revenue trajectory to turn around before making any decisions. Or at the very least, you'd be hoping it doesn't keep underperforming if your plan is to pick up some stock while it's not in favour.
If you'd like to see what analysts are forecasting going forward, you should check out our free report on Aperam.What Are Revenue Growth Metrics Telling Us About The P/S?
The only time you'd be comfortable seeing a P/S like Aperam's is when the company's growth is tracking the industry closely.
In reviewing the last year of financials, we were disheartened to see the company's revenues fell to the tune of 16%. However, a few very strong years before that means that it was still able to grow revenue by an impressive 80% in total over the last three years. So we can start by confirming that the company has generally done a very good job of growing revenue over that time, even though it had some hiccups along the way.
Turning to the outlook, the next year should demonstrate some strength in company's business, generating growth of 1.8% as estimated by the nine analysts watching the company. Meanwhile, the broader industry is forecast to contract by 1.1%, which would indicate the company is doing better than the majority of its peers.
Despite the marginal growth, we find it odd that Aperam is trading at a fairly similar P/S to the industry. It looks like most investors aren't convinced the company can achieve positive future growth in the face of a shrinking broader industry.
What Does Aperam's P/S Mean For Investors?
Using the price-to-sales ratio alone to determine if you should sell your stock isn't sensible, however it can be a practical guide to the company's future prospects.
Our examination of Aperam's analyst forecasts revealed that its superior revenue outlook against a shaky industry isn't resulting in the company trading at a higher P/S, as per our expectations. We assume that investors are attributing some risk to the company's future revenues, keeping it from trading at a higher P/S. Perhaps there is some hesitation about the company's ability to keep swimming against the current of the broader industry turmoil. However, if you agree with the analysts' forecasts, you may be able to pick up the stock at an attractive price.
We don't want to rain on the parade too much, but we did also find 3 warning signs for Aperam (1 doesn't sit too well with us!) that you need to be mindful of.
It's important to make sure you look for a great company, not just the first idea you come across. So if growing profitability aligns with your idea of a great company, take a peek at this free list of interesting companies with strong recent earnings growth (and a low P/E).
New: Manage All Your Stock Portfolios in One Place
We've created the ultimate portfolio companion for stock investors, and it's free.
• Connect an unlimited number of Portfolios and see your total in one currency
• Be alerted to new Warning Signs or Risks via email or mobile
• Track the Fair Value of your stocks
Have feedback on this article? Concerned about the content? Get in touch with us directly. Alternatively, email editorial-team (at) simplywallst.com.
This article by Simply Wall St is general in nature. We provide commentary based on historical data and analyst forecasts only using an unbiased methodology and our articles are not intended to be financial advice. It does not constitute a recommendation to buy or sell any stock, and does not take account of your objectives, or your financial situation. We aim to bring you long-term focused analysis driven by fundamental data. Note that our analysis may not factor in the latest price-sensitive company announcements or qualitative material. Simply Wall St has no position in any stocks mentioned.
About ENXTAM:APAM
6 star dividend payer and undervalued.
Similar Companies
Market Insights

Advertisement
Community Narratives
The "Molecular Pencil": Why Beam's Technology is Built to Win
Fair Value US$65.01|66.7% undervalued
DA
Community Contributor
The silent giant behind virtually every advanced chip powering AI, smartphones, and modern infrastructure.
Fair Value US$310.00|4.8% undervalued
OS
Community Contributor
ADP Stock: Solid Fundamentals, But AI Investments Test Its Margin Resilience
Fair Value US$387.77|34.5% undervalued
YI
Community Contributor