
Advertisement
- Netherlands
- /
- Electrical
- /
- ENXTAM:TWEKA
Is TKH Group N.V.'s (AMS:TWEKA) Stock's Recent Performance Being Led By Its Attractive Financial Prospects?

Most readers would already be aware that TKH Group's (AMS:TWEKA) stock increased significantly by 25% over the past three months. Given that the market rewards strong financials in the long-term, we wonder if that is the case in this instance. Particularly, we will be paying attention to TKH Group's ROE today.
Return on Equity or ROE is a test of how effectively a company is growing its value and managing investors’ money. Simply put, it is used to assess the profitability of a company in relation to its equity capital.
Check out our latest analysis for TKH Group
How Is ROE Calculated?
Return on equity can be calculated by using the formula:
Return on Equity = Net Profit (from continuing operations) ÷ Shareholders' Equity
So, based on the above formula, the ROE for TKH Group is:
11% = €100m ÷ €883m (Based on the trailing twelve months to December 2024).
The 'return' is the profit over the last twelve months. Another way to think of that is that for every €1 worth of equity, the company was able to earn €0.11 in profit.
What Is The Relationship Between ROE And Earnings Growth?
Thus far, we have learned that ROE measures how efficiently a company is generating its profits. Depending on how much of these profits the company reinvests or "retains", and how effectively it does so, we are then able to assess a company’s earnings growth potential. Assuming everything else remains unchanged, the higher the ROE and profit retention, the higher the growth rate of a company compared to companies that don't necessarily bear these characteristics.
TKH Group's Earnings Growth And 11% ROE
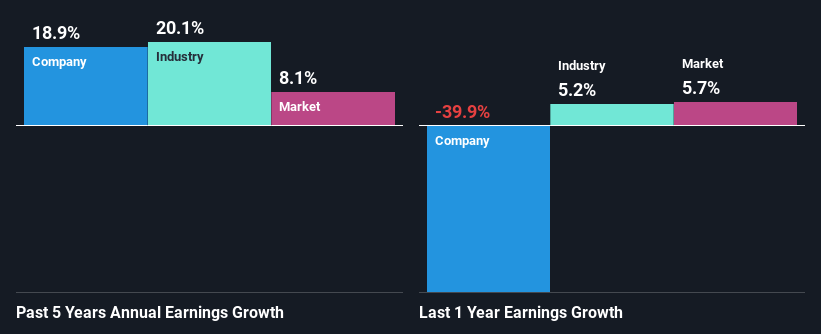
To begin with, TKH Group seems to have a respectable ROE. Even when compared to the industry average of 14% the company's ROE looks quite decent. Consequently, this likely laid the ground for the decent growth of 19% seen over the past five years by TKH Group.
As a next step, we compared TKH Group's net income growth with the industry and found that the company has a similar growth figure when compared with the industry average growth rate of 20% in the same period.
Earnings growth is a huge factor in stock valuation. The investor should try to establish if the expected growth or decline in earnings, whichever the case may be, is priced in. Doing so will help them establish if the stock's future looks promising or ominous. Is TWEKA fairly valued? This infographic on the company's intrinsic value has everything you need to know.
Is TKH Group Making Efficient Use Of Its Profits?
TKH Group has a healthy combination of a moderate three-year median payout ratio of 49% (or a retention ratio of 51%) and a respectable amount of growth in earnings as we saw above, meaning that the company has been making efficient use of its profits.
Besides, TKH Group has been paying dividends for at least ten years or more. This shows that the company is committed to sharing profits with its shareholders. Our latest analyst data shows that the future payout ratio of the company over the next three years is expected to be approximately 47%. Accordingly, forecasts suggest that TKH Group's future ROE will be 13% which is again, similar to the current ROE.
Conclusion
In total, we are pretty happy with TKH Group's performance. Particularly, we like that the company is reinvesting heavily into its business, and at a high rate of return. Unsurprisingly, this has led to an impressive earnings growth. With that said, the latest industry analyst forecasts reveal that the company's earnings growth is expected to slow down. To know more about the latest analysts predictions for the company, check out this visualization of analyst forecasts for the company.
Valuation is complex, but we're here to simplify it.
Discover if TKH Group might be undervalued or overvalued with our detailed analysis, featuring fair value estimates, potential risks, dividends, insider trades, and its financial condition.
Access Free AnalysisHave feedback on this article? Concerned about the content? Get in touch with us directly. Alternatively, email editorial-team (at) simplywallst.com.
This article by Simply Wall St is general in nature. We provide commentary based on historical data and analyst forecasts only using an unbiased methodology and our articles are not intended to be financial advice. It does not constitute a recommendation to buy or sell any stock, and does not take account of your objectives, or your financial situation. We aim to bring you long-term focused analysis driven by fundamental data. Note that our analysis may not factor in the latest price-sensitive company announcements or qualitative material. Simply Wall St has no position in any stocks mentioned.
About ENXTAM:TWEKA
TKH Group
Develops and delivers smart vision, smart manufacturing, and smart connectivity systems in the Netherlands, rest of Europe, Asia, North America, and internationally.
Good value with adequate balance sheet.
Market Insights

Advertisement
Community Narratives
MicroStrategy: Volatile Gamble or Golden Opportunity?
Fair Value US$663.00|36.2% undervalued
BL
Community Contributor
Emerging Markets and Debt Reduction Will Propel Bath & Body Works Forward
Fair Value US$40.73|22.0% undervalued
ZW
Community Contributor
An amazing opportunity to potentially get a 100 bagger
Fair Value US$10.00|46.4% overvalued
DA
Community Contributor