
Advertisement

Warren Buffett famously said, 'Volatility is far from synonymous with risk.' It's only natural to consider a company's balance sheet when you examine how risky it is, since debt is often involved when a business collapses. Importantly, TKH Group N.V. (AMS:TWEKA) does carry debt. But the more important question is: how much risk is that debt creating?
Why Does Debt Bring Risk?
Debt is a tool to help businesses grow, but if a business is incapable of paying off its lenders, then it exists at their mercy. In the worst case scenario, a company can go bankrupt if it cannot pay its creditors. However, a more usual (but still expensive) situation is where a company must dilute shareholders at a cheap share price simply to get debt under control. Having said that, the most common situation is where a company manages its debt reasonably well - and to its own advantage. The first thing to do when considering how much debt a business uses is to look at its cash and debt together.
See our latest analysis for TKH Group
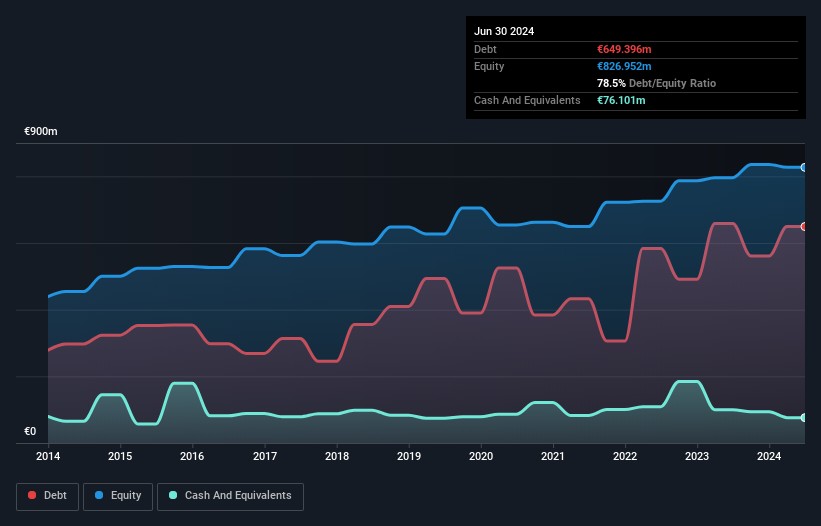
What Is TKH Group's Net Debt?
The chart below, which you can click on for greater detail, shows that TKH Group had €649.4m in debt in June 2024; about the same as the year before. However, because it has a cash reserve of €76.1m, its net debt is less, at about €573.3m.
How Strong Is TKH Group's Balance Sheet?
According to the last reported balance sheet, TKH Group had liabilities of €645.3m due within 12 months, and liabilities of €723.1m due beyond 12 months. On the other hand, it had cash of €76.1m and €459.6m worth of receivables due within a year. So it has liabilities totalling €832.7m more than its cash and near-term receivables, combined.
This is a mountain of leverage relative to its market capitalization of €1.30b. This suggests shareholders would be heavily diluted if the company needed to shore up its balance sheet in a hurry.
We use two main ratios to inform us about debt levels relative to earnings. The first is net debt divided by earnings before interest, tax, depreciation, and amortization (EBITDA), while the second is how many times its earnings before interest and tax (EBIT) covers its interest expense (or its interest cover, for short). The advantage of this approach is that we take into account both the absolute quantum of debt (with net debt to EBITDA) and the actual interest expenses associated with that debt (with its interest cover ratio).
TKH Group's debt is 2.7 times its EBITDA, and its EBIT cover its interest expense 5.5 times over. This suggests that while the debt levels are significant, we'd stop short of calling them problematic. Importantly, TKH Group's EBIT fell a jaw-dropping 20% in the last twelve months. If that decline continues then paying off debt will be harder than selling foie gras at a vegan convention. When analysing debt levels, the balance sheet is the obvious place to start. But it is future earnings, more than anything, that will determine TKH Group's ability to maintain a healthy balance sheet going forward. So if you want to see what the professionals think, you might find this free report on analyst profit forecasts to be interesting.
But our final consideration is also important, because a company cannot pay debt with paper profits; it needs cold hard cash. So it's worth checking how much of that EBIT is backed by free cash flow. Over the last three years, TKH Group recorded negative free cash flow, in total. Debt is usually more expensive, and almost always more risky in the hands of a company with negative free cash flow. Shareholders ought to hope for an improvement.
Our View
On the face of it, TKH Group's conversion of EBIT to free cash flow left us tentative about the stock, and its EBIT growth rate was no more enticing than the one empty restaurant on the busiest night of the year. Having said that, its ability to cover its interest expense with its EBIT isn't such a worry. We're quite clear that we consider TKH Group to be really rather risky, as a result of its balance sheet health. So we're almost as wary of this stock as a hungry kitten is about falling into its owner's fish pond: once bitten, twice shy, as they say. When analysing debt levels, the balance sheet is the obvious place to start. However, not all investment risk resides within the balance sheet - far from it. We've identified 3 warning signs with TKH Group , and understanding them should be part of your investment process.
At the end of the day, it's often better to focus on companies that are free from net debt. You can access our special list of such companies (all with a track record of profit growth). It's free.
Valuation is complex, but we're here to simplify it.
Discover if TKH Group might be undervalued or overvalued with our detailed analysis, featuring fair value estimates, potential risks, dividends, insider trades, and its financial condition.
Access Free AnalysisHave feedback on this article? Concerned about the content? Get in touch with us directly. Alternatively, email editorial-team (at) simplywallst.com.
This article by Simply Wall St is general in nature. We provide commentary based on historical data and analyst forecasts only using an unbiased methodology and our articles are not intended to be financial advice. It does not constitute a recommendation to buy or sell any stock, and does not take account of your objectives, or your financial situation. We aim to bring you long-term focused analysis driven by fundamental data. Note that our analysis may not factor in the latest price-sensitive company announcements or qualitative material. Simply Wall St has no position in any stocks mentioned.
About ENXTAM:TWEKA
TKH Group
Develops and delivers smart vision, smart manufacturing, and smart connectivity systems in the Netherlands, rest of Europe, Asia, North America, and internationally.
Good value with adequate balance sheet.
Market Insights


Advertisement
Community Narratives
For the Emperor: Why Games Workshop Could Be a Star Investment
Fair Value UK£160.00|0.4% overvalued
RO
Community Contributor
Securitas will boost margins with AI and tech-driven services
Fair Value SEK 260.91|44.5% undervalued
UN
Community Contributor
A Leader in EV Charging with Growth Potential
Fair Value €27.00|17.8% undervalued
TI
Community Contributor