
Advertisement
- Netherlands
- /
- Construction
- /
- ENXTAM:BAMNB
Further weakness as Koninklijke BAM Groep (AMS:BAMNB) drops 8.8% this week, taking five-year losses to 42%
The main aim of stock picking is to find the market-beating stocks. But in any portfolio, there will be mixed results between individual stocks. So we wouldn't blame long term Koninklijke BAM Groep nv (AMS:BAMNB) shareholders for doubting their decision to hold, with the stock down 48% over a half decade. And we doubt long term believers are the only worried holders, since the stock price has declined 29% over the last twelve months. The last week also saw the share price slip down another 8.8%. But this could be related to the soft market, which is down about 3.9% in the same period.
If the past week is anything to go by, investor sentiment for Koninklijke BAM Groep isn't positive, so let's see if there's a mismatch between fundamentals and the share price.
See our latest analysis for Koninklijke BAM Groep
To paraphrase Benjamin Graham: Over the short term the market is a voting machine, but over the long term it's a weighing machine. One imperfect but simple way to consider how the market perception of a company has shifted is to compare the change in the earnings per share (EPS) with the share price movement.
During five years of share price growth, Koninklijke BAM Groep moved from a loss to profitability. That would generally be considered a positive, so we are surprised to see the share price is down. Other metrics might give us a better handle on how its value is changing over time.
We note that the dividend has remained healthy, so that wouldn't really explain the share price drop. It's not immediately clear to us why the stock price is down but further research might provide some answers.
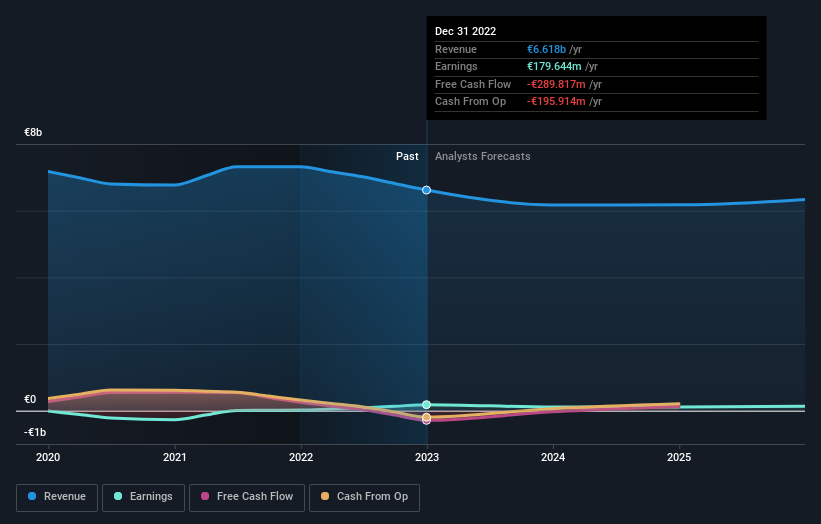
You can see how earnings and revenue have changed over time in the image below (click on the chart to see the exact values).
We know that Koninklijke BAM Groep has improved its bottom line over the last three years, but what does the future have in store? You can see how its balance sheet has strengthened (or weakened) over time in this free interactive graphic.
What About Dividends?
As well as measuring the share price return, investors should also consider the total shareholder return (TSR). Whereas the share price return only reflects the change in the share price, the TSR includes the value of dividends (assuming they were reinvested) and the benefit of any discounted capital raising or spin-off. It's fair to say that the TSR gives a more complete picture for stocks that pay a dividend. In the case of Koninklijke BAM Groep, it has a TSR of -42% for the last 5 years. That exceeds its share price return that we previously mentioned. The dividends paid by the company have thusly boosted the total shareholder return.
A Different Perspective
While the broader market gained around 4.9% in the last year, Koninklijke BAM Groep shareholders lost 23% (even including dividends). However, keep in mind that even the best stocks will sometimes underperform the market over a twelve month period. Unfortunately, last year's performance may indicate unresolved challenges, given that it was worse than the annualised loss of 7% over the last half decade. Generally speaking long term share price weakness can be a bad sign, though contrarian investors might want to research the stock in hope of a turnaround. While it is well worth considering the different impacts that market conditions can have on the share price, there are other factors that are even more important. Like risks, for instance. Every company has them, and we've spotted 3 warning signs for Koninklijke BAM Groep (of which 1 makes us a bit uncomfortable!) you should know about.
But note: Koninklijke BAM Groep may not be the best stock to buy. So take a peek at this free list of interesting companies with past earnings growth (and further growth forecast).
Please note, the market returns quoted in this article reflect the market weighted average returns of stocks that currently trade on Dutch exchanges.
Valuation is complex, but we're here to simplify it.
Discover if Koninklijke BAM Groep might be undervalued or overvalued with our detailed analysis, featuring fair value estimates, potential risks, dividends, insider trades, and its financial condition.
Access Free AnalysisHave feedback on this article? Concerned about the content? Get in touch with us directly. Alternatively, email editorial-team (at) simplywallst.com.
This article by Simply Wall St is general in nature. We provide commentary based on historical data and analyst forecasts only using an unbiased methodology and our articles are not intended to be financial advice. It does not constitute a recommendation to buy or sell any stock, and does not take account of your objectives, or your financial situation. We aim to bring you long-term focused analysis driven by fundamental data. Note that our analysis may not factor in the latest price-sensitive company announcements or qualitative material. Simply Wall St has no position in any stocks mentioned.
About ENXTAM:BAMNB
Koninklijke BAM Groep
Provides products and services in the construction and property, civil engineering, and public private partnerships (PPP) sectors worldwide.
Excellent balance sheet with reasonable growth potential and pays a dividend.
Similar Companies
Market Insights

Advertisement
Community Narratives
A formidable player in AI and enterprise computing.
Fair Value US$210.00|2.3% overvalued
CO
Community Contributor
IREN's Bold Moves in Sustainable Bitcoin Mining & AI Data Centers
Fair Value US$72.52|17.6% undervalued
BL
Community Contributor
Cooling the Champions: The Aussie Tech Behind F1's Victories
Fair Value AU$12.40|40.4% undervalued
TR
Community Contributor