
Advertisement
- Malaysia
- /
- Marine and Shipping
- /
- KLSE:MISC
MISC Berhad (KLSE:MISC) Stock's On A Decline: Are Poor Fundamentals The Cause?
With its stock down 3.2% over the past week, it is easy to disregard MISC Berhad (KLSE:MISC). To decide if this trend could continue, we decided to look at its weak fundamentals as they shape the long-term market trends. In this article, we decided to focus on MISC Berhad's ROE.
Return on equity or ROE is a key measure used to assess how efficiently a company's management is utilizing the company's capital. Put another way, it reveals the company's success at turning shareholder investments into profits.
See our latest analysis for MISC Berhad
How To Calculate Return On Equity?
ROE can be calculated by using the formula:
Return on Equity = Net Profit (from continuing operations) ÷ Shareholders' Equity
So, based on the above formula, the ROE for MISC Berhad is:
4.8% = RM1.8b ÷ RM38b (Based on the trailing twelve months to December 2022).
The 'return' is the yearly profit. Another way to think of that is that for every MYR1 worth of equity, the company was able to earn MYR0.05 in profit.
What Has ROE Got To Do With Earnings Growth?
Thus far, we have learned that ROE measures how efficiently a company is generating its profits. Depending on how much of these profits the company reinvests or "retains", and how effectively it does so, we are then able to assess a company’s earnings growth potential. Assuming everything else remains unchanged, the higher the ROE and profit retention, the higher the growth rate of a company compared to companies that don't necessarily bear these characteristics.
MISC Berhad's Earnings Growth And 4.8% ROE
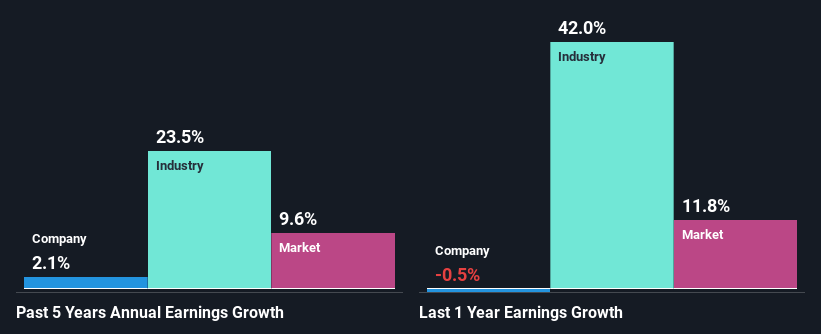
It is quite clear that MISC Berhad's ROE is rather low. Even compared to the average industry ROE of 16%, the company's ROE is quite dismal. Thus, the low net income growth of 2.1% seen by MISC Berhad over the past five years could probably be the result of it having a lower ROE.
Next, on comparing with the industry net income growth, we found that MISC Berhad's reported growth was lower than the industry growth of 24% in the same period, which is not something we like to see.
Earnings growth is a huge factor in stock valuation. What investors need to determine next is if the expected earnings growth, or the lack of it, is already built into the share price. By doing so, they will have an idea if the stock is headed into clear blue waters or if swampy waters await. One good indicator of expected earnings growth is the P/E ratio which determines the price the market is willing to pay for a stock based on its earnings prospects. So, you may want to check if MISC Berhad is trading on a high P/E or a low P/E, relative to its industry.
Is MISC Berhad Efficiently Re-investing Its Profits?
The high three-year median payout ratio of 81% (that is, the company retains only 19% of its income) over the past three years for MISC Berhad suggests that the company's earnings growth was lower as a result of paying out a majority of its earnings.
In addition, MISC Berhad has been paying dividends over a period of nine years suggesting that keeping up dividend payments is way more important to the management even if it comes at the cost of business growth. Existing analyst estimates suggest that the company's future payout ratio is expected to drop to 59% over the next three years. As a result, the expected drop in MISC Berhad's payout ratio explains the anticipated rise in the company's future ROE to 6.1%, over the same period.
Conclusion
Overall, we would be extremely cautious before making any decision on MISC Berhad. As a result of its low ROE and lack of much reinvestment into the business, the company has seen a disappointing earnings growth rate. That being so, the latest analyst forecasts show that the company will continue to see an expansion in its earnings. To know more about the company's future earnings growth forecasts take a look at this free report on analyst forecasts for the company to find out more.
New: Manage All Your Stock Portfolios in One Place
We've created the ultimate portfolio companion for stock investors, and it's free.
• Connect an unlimited number of Portfolios and see your total in one currency
• Be alerted to new Warning Signs or Risks via email or mobile
• Track the Fair Value of your stocks
Have feedback on this article? Concerned about the content? Get in touch with us directly. Alternatively, email editorial-team (at) simplywallst.com.
This article by Simply Wall St is general in nature. We provide commentary based on historical data and analyst forecasts only using an unbiased methodology and our articles are not intended to be financial advice. It does not constitute a recommendation to buy or sell any stock, and does not take account of your objectives, or your financial situation. We aim to bring you long-term focused analysis driven by fundamental data. Note that our analysis may not factor in the latest price-sensitive company announcements or qualitative material. Simply Wall St has no position in any stocks mentioned.
About KLSE:MISC
MISC Berhad
Engages in ship ownership and operation, other activities related to shipping services, and the operation of offshore floating terminals in Malaysia, the United States, Asia, Africa, and Europe.
Excellent balance sheet average dividend payer.
Similar Companies
Market Insights

Advertisement
Community Narratives
MicroVision will explode future revenue by 380.37% with a vision towards success
Fair Value US$60.00|98.4% undervalued
TH
Community Contributor
The Indispensable Artery for a New North American Economy
Fair Value CA$132.87|1.3% undervalued
TI
Community Contributor