
Advertisement
Investors Still Aren't Entirely Convinced By MMAG Holdings Berhad's (KLSE:MMAG) Revenues Despite 92% Price Jump
Despite an already strong run, MMAG Holdings Berhad (KLSE:MMAG) shares have been powering on, with a gain of 92% in the last thirty days. The annual gain comes to 150% following the latest surge, making investors sit up and take notice.
Even after such a large jump in price, you could still be forgiven for feeling indifferent about MMAG Holdings Berhad's P/S ratio of 1.4x, since the median price-to-sales (or "P/S") ratio for the IT industry in Malaysia is also close to 1.2x. Although, it's not wise to simply ignore the P/S without explanation as investors may be disregarding a distinct opportunity or a costly mistake.
View our latest analysis for MMAG Holdings Berhad
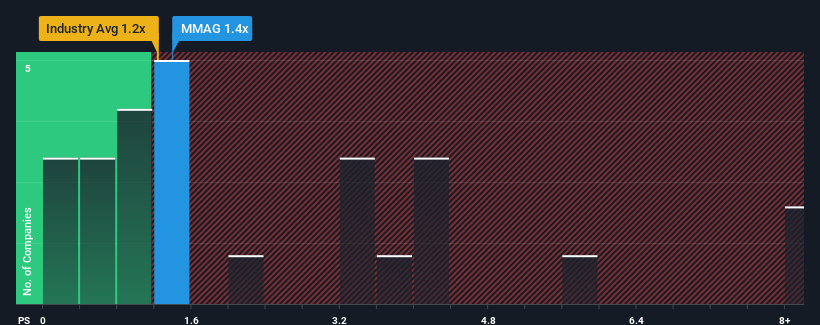
What Does MMAG Holdings Berhad's P/S Mean For Shareholders?
Revenue has risen firmly for MMAG Holdings Berhad recently, which is pleasing to see. One possibility is that the P/S is moderate because investors think this respectable revenue growth might not be enough to outperform the broader industry in the near future. If that doesn't eventuate, then existing shareholders probably aren't too pessimistic about the future direction of the share price.
Want the full picture on earnings, revenue and cash flow for the company? Then our free report on MMAG Holdings Berhad will help you shine a light on its historical performance.What Are Revenue Growth Metrics Telling Us About The P/S?
MMAG Holdings Berhad's P/S ratio would be typical for a company that's only expected to deliver moderate growth, and importantly, perform in line with the industry.
Retrospectively, the last year delivered an exceptional 17% gain to the company's top line. The latest three year period has also seen an excellent 110% overall rise in revenue, aided by its short-term performance. Therefore, it's fair to say the revenue growth recently has been superb for the company.
This is in contrast to the rest of the industry, which is expected to grow by 9.9% over the next year, materially lower than the company's recent medium-term annualised growth rates.
With this information, we find it interesting that MMAG Holdings Berhad is trading at a fairly similar P/S compared to the industry. It may be that most investors are not convinced the company can maintain its recent growth rates.
The Final Word
Its shares have lifted substantially and now MMAG Holdings Berhad's P/S is back within range of the industry median. Using the price-to-sales ratio alone to determine if you should sell your stock isn't sensible, however it can be a practical guide to the company's future prospects.
We've established that MMAG Holdings Berhad currently trades on a lower than expected P/S since its recent three-year growth is higher than the wider industry forecast. There could be some unobserved threats to revenue preventing the P/S ratio from matching this positive performance. While recent revenue trends over the past medium-term suggest that the risk of a price decline is low, investors appear to see the likelihood of revenue fluctuations in the future.
It's always necessary to consider the ever-present spectre of investment risk. We've identified 3 warning signs with MMAG Holdings Berhad, and understanding these should be part of your investment process.
If you're unsure about the strength of MMAG Holdings Berhad's business, why not explore our interactive list of stocks with solid business fundamentals for some other companies you may have missed.
New: Manage All Your Stock Portfolios in One Place
We've created the ultimate portfolio companion for stock investors, and it's free.
• Connect an unlimited number of Portfolios and see your total in one currency
• Be alerted to new Warning Signs or Risks via email or mobile
• Track the Fair Value of your stocks
Have feedback on this article? Concerned about the content? Get in touch with us directly. Alternatively, email editorial-team (at) simplywallst.com.
This article by Simply Wall St is general in nature. We provide commentary based on historical data and analyst forecasts only using an unbiased methodology and our articles are not intended to be financial advice. It does not constitute a recommendation to buy or sell any stock, and does not take account of your objectives, or your financial situation. We aim to bring you long-term focused analysis driven by fundamental data. Note that our analysis may not factor in the latest price-sensitive company announcements or qualitative material. Simply Wall St has no position in any stocks mentioned.
About KLSE:MMAG
MMAG Holdings Berhad
An investment holding company, provides information technology products in Malaysia, Singapore, Hong Kong, Vietnam, India, Myanmar, and internationally.
Mediocre balance sheet with low risk.
Market Insights

Advertisement
Community Narratives
The company that turned a verb into a global necessity and basically runs the modern internet, digital ads, smartphones, maps, and AI.
Fair Value US$300.00|5.1% undervalued
OS
Community Contributor
Flowers Foods Pays A Fair Price For Health
Fair Value US$16.12|27.7% undervalued
NV
Community Contributor
TMX Group will thrive with 33.3% profit margin and enduring market moat
Fair Value CA$49.90|0.2% overvalued
LI
Community Contributor
The "Molecular Pencil": Why Beam's Technology is Built to Win
Fair Value US$65.01|64.4% undervalued
DA
Community Contributor