
Advertisement
Risks Still Elevated At These Prices As FSBM Holdings Berhad (KLSE:FSBM) Shares Dive 25%
The FSBM Holdings Berhad (KLSE:FSBM) share price has fared very poorly over the last month, falling by a substantial 25%. Instead of being rewarded, shareholders who have already held through the last twelve months are now sitting on a 17% share price drop.
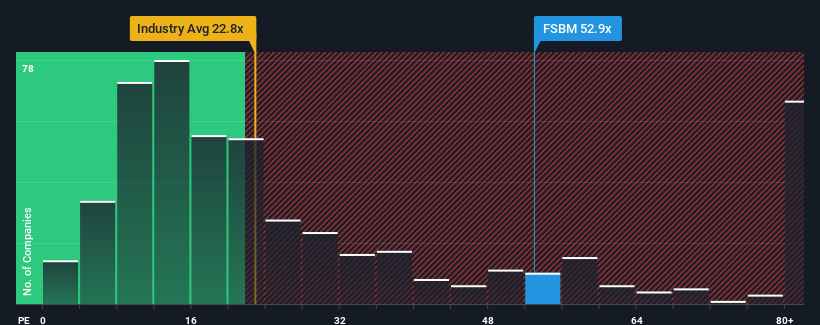
Even after such a large drop in price, FSBM Holdings Berhad may still be sending very bearish signals at the moment with a price-to-earnings (or "P/E") ratio of 52.9x, since almost half of all companies in Malaysia have P/E ratios under 17x and even P/E's lower than 10x are not unusual. However, the P/E might be quite high for a reason and it requires further investigation to determine if it's justified.
As an illustration, earnings have deteriorated at FSBM Holdings Berhad over the last year, which is not ideal at all. One possibility is that the P/E is high because investors think the company will still do enough to outperform the broader market in the near future. If not, then existing shareholders may be quite nervous about the viability of the share price.
See our latest analysis for FSBM Holdings Berhad
Does Growth Match The High P/E?
FSBM Holdings Berhad's P/E ratio would be typical for a company that's expected to deliver very strong growth, and importantly, perform much better than the market.
Taking a look back first, the company's earnings per share growth last year wasn't something to get excited about as it posted a disappointing decline of 70%. Unfortunately, that's brought it right back to where it started three years ago with EPS growth being virtually non-existent overall during that time. So it appears to us that the company has had a mixed result in terms of growing earnings over that time.
Comparing that to the market, which is predicted to deliver 18% growth in the next 12 months, the company's momentum is weaker based on recent medium-term annualised earnings results.
In light of this, it's alarming that FSBM Holdings Berhad's P/E sits above the majority of other companies. It seems most investors are ignoring the fairly limited recent growth rates and are hoping for a turnaround in the company's business prospects. Only the boldest would assume these prices are sustainable as a continuation of recent earnings trends is likely to weigh heavily on the share price eventually.
What We Can Learn From FSBM Holdings Berhad's P/E?
Even after such a strong price drop, FSBM Holdings Berhad's P/E still exceeds the rest of the market significantly. Using the price-to-earnings ratio alone to determine if you should sell your stock isn't sensible, however it can be a practical guide to the company's future prospects.
Our examination of FSBM Holdings Berhad revealed its three-year earnings trends aren't impacting its high P/E anywhere near as much as we would have predicted, given they look worse than current market expectations. When we see weak earnings with slower than market growth, we suspect the share price is at risk of declining, sending the high P/E lower. If recent medium-term earnings trends continue, it will place shareholders' investments at significant risk and potential investors in danger of paying an excessive premium.
Before you take the next step, you should know about the 6 warning signs for FSBM Holdings Berhad (2 are potentially serious!) that we have uncovered.
Of course, you might also be able to find a better stock than FSBM Holdings Berhad. So you may wish to see this free collection of other companies that have reasonable P/E ratios and have grown earnings strongly.
New: AI Stock Screener & Alerts
Our new AI Stock Screener scans the market every day to uncover opportunities.
• Dividend Powerhouses (3%+ Yield)
• Undervalued Small Caps with Insider Buying
• High growth Tech and AI Companies
Or build your own from over 50 metrics.
Have feedback on this article? Concerned about the content? Get in touch with us directly. Alternatively, email editorial-team (at) simplywallst.com.
This article by Simply Wall St is general in nature. We provide commentary based on historical data and analyst forecasts only using an unbiased methodology and our articles are not intended to be financial advice. It does not constitute a recommendation to buy or sell any stock, and does not take account of your objectives, or your financial situation. We aim to bring you long-term focused analysis driven by fundamental data. Note that our analysis may not factor in the latest price-sensitive company announcements or qualitative material. Simply Wall St has no position in any stocks mentioned.
Have feedback on this article? Concerned about the content? Get in touch with us directly. Alternatively, email editorial-team@simplywallst.com
About KLSE:FSBM
FSBM Holdings Berhad
An investment holding company, distributes computers, computer related products, and education related products in Malaysia.
Adequate balance sheet with very low risk.
Market Insights

Advertisement
Community Narratives
MINISO's fair value is projected at 26.69 with an anticipated PE ratio shift of 20x
Fair Value US$24.03|11.4% undervalued
BE
Community Contributor
Procter & Gamble: A Dividend Giant Facing Slowing Growth
Fair Value US$119.81|23.5% overvalued
AN
Community Contributor
Eli Lilly's Future Growth Driven by Tirzepatide and Favorable Market Conditions
Fair Value US$1.19k|14.0% undervalued
EA
Community Contributor