
Advertisement
Excel Force MSC Berhad's (KLSE:EFORCE) Stock Has Shown Weakness Lately But Financial Prospects Look Decent: Is The Market Wrong?
It is hard to get excited after looking at Excel Force MSC Berhad's (KLSE:EFORCE) recent performance, when its stock has declined 13% over the past month. However, the company's fundamentals look pretty decent, and long-term financials are usually aligned with future market price movements. Particularly, we will be paying attention to Excel Force MSC Berhad's ROE today.
Return on Equity or ROE is a test of how effectively a company is growing its value and managing investors’ money. Put another way, it reveals the company's success at turning shareholder investments into profits.
See our latest analysis for Excel Force MSC Berhad
How Is ROE Calculated?
ROE can be calculated by using the formula:
Return on Equity = Net Profit (from continuing operations) ÷ Shareholders' Equity
So, based on the above formula, the ROE for Excel Force MSC Berhad is:
8.1% = RM7.9m ÷ RM97m (Based on the trailing twelve months to June 2023).
The 'return' is the income the business earned over the last year. Another way to think of that is that for every MYR1 worth of equity, the company was able to earn MYR0.08 in profit.
Why Is ROE Important For Earnings Growth?
Thus far, we have learned that ROE measures how efficiently a company is generating its profits. We now need to evaluate how much profit the company reinvests or "retains" for future growth which then gives us an idea about the growth potential of the company. Assuming everything else remains unchanged, the higher the ROE and profit retention, the higher the growth rate of a company compared to companies that don't necessarily bear these characteristics.
Excel Force MSC Berhad's Earnings Growth And 8.1% ROE
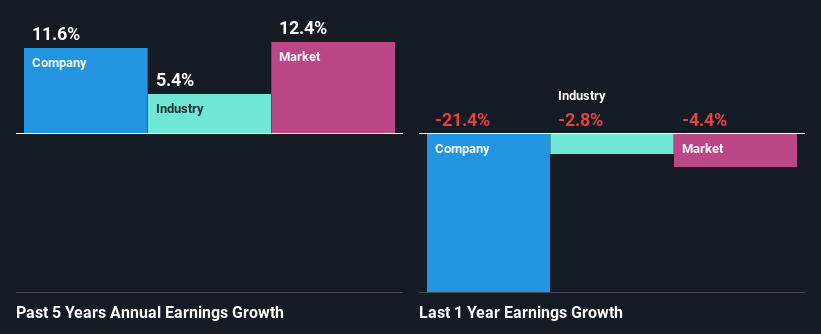
When you first look at it, Excel Force MSC Berhad's ROE doesn't look that attractive. Although a closer study shows that the company's ROE is higher than the industry average of 6.5% which we definitely can't overlook. Consequently, this likely laid the ground for the decent growth of 12% seen over the past five years by Excel Force MSC Berhad. Bear in mind, the company does have a moderately low ROE. It is just that the industry ROE is lower. So there might well be other reasons for the earnings to grow. E.g the company has a low payout ratio or could belong to a high growth industry.
As a next step, we compared Excel Force MSC Berhad's net income growth with the industry, and pleasingly, we found that the growth seen by the company is higher than the average industry growth of 5.4%.
Earnings growth is a huge factor in stock valuation. The investor should try to establish if the expected growth or decline in earnings, whichever the case may be, is priced in. By doing so, they will have an idea if the stock is headed into clear blue waters or if swampy waters await. One good indicator of expected earnings growth is the P/E ratio which determines the price the market is willing to pay for a stock based on its earnings prospects. So, you may want to check if Excel Force MSC Berhad is trading on a high P/E or a low P/E, relative to its industry.
Is Excel Force MSC Berhad Using Its Retained Earnings Effectively?
Excel Force MSC Berhad has a significant three-year median payout ratio of 64%, meaning that it is left with only 36% to reinvest into its business. This implies that the company has been able to achieve decent earnings growth despite returning most of its profits to shareholders.
Additionally, Excel Force MSC Berhad has paid dividends over a period of at least ten years which means that the company is pretty serious about sharing its profits with shareholders.
Conclusion
In total, it does look like Excel Force MSC Berhad has some positive aspects to its business. Specifically, its respectable ROE which likely led to the considerable growth in earnings. Yet, the company is retaining a small portion of its profits. Which means that the company has been able to grow its earnings in spite of it, so that's not too bad. So far, we've only made a quick discussion around the company's earnings growth. So it may be worth checking this free detailed graph of Excel Force MSC Berhad's past earnings, as well as revenue and cash flows to get a deeper insight into the company's performance.
Valuation is complex, but we're here to simplify it.
Discover if Excel Force MSC Berhad might be undervalued or overvalued with our detailed analysis, featuring fair value estimates, potential risks, dividends, insider trades, and its financial condition.
Access Free AnalysisHave feedback on this article? Concerned about the content? Get in touch with us directly. Alternatively, email editorial-team (at) simplywallst.com.
This article by Simply Wall St is general in nature. We provide commentary based on historical data and analyst forecasts only using an unbiased methodology and our articles are not intended to be financial advice. It does not constitute a recommendation to buy or sell any stock, and does not take account of your objectives, or your financial situation. We aim to bring you long-term focused analysis driven by fundamental data. Note that our analysis may not factor in the latest price-sensitive company announcements or qualitative material. Simply Wall St has no position in any stocks mentioned.
About KLSE:EFORCE
Excel Force MSC Berhad
Develops, provides, and maintains software application solutions for the financial services industry in Malaysia.
Excellent balance sheet with slight risk.
Similar Companies
Market Insights

Advertisement
Community Narratives
MINISO's fair value is projected at 26.69 with an anticipated PE ratio shift of 20x
Fair Value US$24.03|11.0% undervalued
BE
Community Contributor
Procter & Gamble: A Dividend Giant Facing Slowing Growth
Fair Value US$119.81|23.3% overvalued
AN
Community Contributor
Eli Lilly's Future Growth Driven by Tirzepatide and Favorable Market Conditions
Fair Value US$1.19k|13.8% undervalued
EA
Community Contributor