
Advertisement
Key Insights
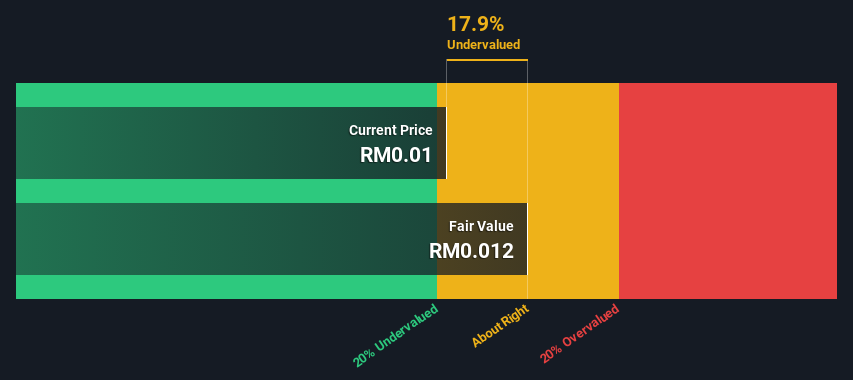
- Using the 2 Stage Free Cash Flow to Equity, EA Holdings Berhad fair value estimate is RM0.012
- Current share price of RM0.01 suggests EA Holdings Berhad is potentially trading close to its fair value
- EA Holdings Berhad's peers are currently trading at a premium of 122% on average
How far off is EA Holdings Berhad (KLSE:EAH) from its intrinsic value? Using the most recent financial data, we'll take a look at whether the stock is fairly priced by estimating the company's future cash flows and discounting them to their present value. We will take advantage of the Discounted Cash Flow (DCF) model for this purpose. Models like these may appear beyond the comprehension of a lay person, but they're fairly easy to follow.
We generally believe that a company's value is the present value of all of the cash it will generate in the future. However, a DCF is just one valuation metric among many, and it is not without flaws. For those who are keen learners of equity analysis, the Simply Wall St analysis model here may be something of interest to you.
View our latest analysis for EA Holdings Berhad
Crunching The Numbers
We use what is known as a 2-stage model, which simply means we have two different periods of growth rates for the company's cash flows. Generally the first stage is higher growth, and the second stage is a lower growth phase. To begin with, we have to get estimates of the next ten years of cash flows. Seeing as no analyst estimates of free cash flow are available to us, we have extrapolate the previous free cash flow (FCF) from the company's last reported value. We assume companies with shrinking free cash flow will slow their rate of shrinkage, and that companies with growing free cash flow will see their growth rate slow, over this period. We do this to reflect that growth tends to slow more in the early years than it does in later years.
Generally we assume that a dollar today is more valuable than a dollar in the future, so we need to discount the sum of these future cash flows to arrive at a present value estimate:
10-year free cash flow (FCF) forecast
| 2024 | 2025 | 2026 | 2027 | 2028 | 2029 | 2030 | 2031 | 2032 | 2033 | |
| Levered FCF (MYR, Millions) | RM5.12m | RM5.61m | RM6.04m | RM6.43m | RM6.79m | RM7.13m | RM7.45m | RM7.77m | RM8.08m | RM8.40m |
| Growth Rate Estimate Source | Est @ 12.09% | Est @ 9.53% | Est @ 7.74% | Est @ 6.48% | Est @ 5.60% | Est @ 4.99% | Est @ 4.56% | Est @ 4.25% | Est @ 4.04% | Est @ 3.89% |
| Present Value (MYR, Millions) Discounted @ 11% | RM4.6 | RM4.5 | RM4.4 | RM4.2 | RM4.0 | RM3.8 | RM3.6 | RM3.3 | RM3.1 | RM2.9 |
("Est" = FCF growth rate estimated by Simply Wall St)
Present Value of 10-year Cash Flow (PVCF) = RM39m
The second stage is also known as Terminal Value, this is the business's cash flow after the first stage. For a number of reasons a very conservative growth rate is used that cannot exceed that of a country's GDP growth. In this case we have used the 5-year average of the 10-year government bond yield (3.6%) to estimate future growth. In the same way as with the 10-year 'growth' period, we discount future cash flows to today's value, using a cost of equity of 11%.
Terminal Value (TV)= FCF2033 × (1 + g) ÷ (r – g) = RM8.4m× (1 + 3.6%) ÷ (11%– 3.6%) = RM115m
Present Value of Terminal Value (PVTV)= TV / (1 + r)10= RM115m÷ ( 1 + 11%)10= RM40m
The total value, or equity value, is then the sum of the present value of the future cash flows, which in this case is RM79m. To get the intrinsic value per share, we divide this by the total number of shares outstanding. Compared to the current share price of RM0.01, the company appears about fair value at a 18% discount to where the stock price trades currently. The assumptions in any calculation have a big impact on the valuation, so it is better to view this as a rough estimate, not precise down to the last cent.
The Assumptions
Now the most important inputs to a discounted cash flow are the discount rate, and of course, the actual cash flows. You don't have to agree with these inputs, I recommend redoing the calculations yourself and playing with them. The DCF also does not consider the possible cyclicality of an industry, or a company's future capital requirements, so it does not give a full picture of a company's potential performance. Given that we are looking at EA Holdings Berhad as potential shareholders, the cost of equity is used as the discount rate, rather than the cost of capital (or weighted average cost of capital, WACC) which accounts for debt. In this calculation we've used 11%, which is based on a levered beta of 1.109. Beta is a measure of a stock's volatility, compared to the market as a whole. We get our beta from the industry average beta of globally comparable companies, with an imposed limit between 0.8 and 2.0, which is a reasonable range for a stable business.
SWOT Analysis for EA Holdings Berhad
Strength
- Debt is well covered by cash flow.
Weakness
- Interest payments on debt are not well covered.
Opportunity
- Has sufficient cash runway for more than 3 years based on current free cash flows.
- Current share price is below our estimate of fair value.
- Lack of analyst coverage makes it difficult to determine EAH's earnings prospects.
Threat
- No apparent threats visible for EAH.
Next Steps:
Although the valuation of a company is important, it ideally won't be the sole piece of analysis you scrutinize for a company. It's not possible to obtain a foolproof valuation with a DCF model. Instead the best use for a DCF model is to test certain assumptions and theories to see if they would lead to the company being undervalued or overvalued. For example, changes in the company's cost of equity or the risk free rate can significantly impact the valuation. For EA Holdings Berhad, there are three essential aspects you should look at:
- Risks: Consider for instance, the ever-present spectre of investment risk. We've identified 2 warning signs with EA Holdings Berhad (at least 1 which is concerning) , and understanding these should be part of your investment process.
- Other High Quality Alternatives: Do you like a good all-rounder? Explore our interactive list of high quality stocks to get an idea of what else is out there you may be missing!
- Other Top Analyst Picks: Interested to see what the analysts are thinking? Take a look at our interactive list of analysts' top stock picks to find out what they feel might have an attractive future outlook!
PS. The Simply Wall St app conducts a discounted cash flow valuation for every stock on the KLSE every day. If you want to find the calculation for other stocks just search here.
Valuation is complex, but we're here to simplify it.
Discover if EA Holdings Berhad might be undervalued or overvalued with our detailed analysis, featuring fair value estimates, potential risks, dividends, insider trades, and its financial condition.
Access Free AnalysisHave feedback on this article? Concerned about the content? Get in touch with us directly. Alternatively, email editorial-team (at) simplywallst.com.
This article by Simply Wall St is general in nature. We provide commentary based on historical data and analyst forecasts only using an unbiased methodology and our articles are not intended to be financial advice. It does not constitute a recommendation to buy or sell any stock, and does not take account of your objectives, or your financial situation. We aim to bring you long-term focused analysis driven by fundamental data. Note that our analysis may not factor in the latest price-sensitive company announcements or qualitative material. Simply Wall St has no position in any stocks mentioned.
About KLSE:EAH
EA Holdings Berhad
An investment holding company, provides business intelligence software and development, IT service management consultancy, and system integration services in Malaysia.
Excellent balance sheet with acceptable track record.
Market Insights

Advertisement
Weekly Picks
RO


RockeTeller on Santacruz Silver Mining ·
Crazy Undervalued 42 Baggers Silver Play (Active & Running Mine)
Fair Value:CA$8696.7% undervalued
51 followersusers have followed this narrative
6 commentsusers have commented on this narrative
16 likesusers have liked this narrative
RO


Robbo on Fiducian Group ·
Fiducian: Compliance Clouds or Value Opportunity?
Fair Value:AU$122.0% undervalued
8 followersusers have followed this narrative
0 commentsusers have commented on this narrative
0 likesusers have liked this narrative
WO

woodworthfund on Willamette Valley Vineyards ·
Willamette Valley Vineyards (WVVI): Not-So-Great Value
Fair Value:US$242.5% overvalued
10 followersusers have followed this narrative
0 commentsusers have commented on this narrative
1 likeusers have liked this narrative
Recently Updated Narratives
MO


mo7md on ADNOC Gas ·
ADNOC Gas future shines with a 21.4% revenue surge
Fair Value:د.إ3.728.9% undervalued
2 followersusers have followed this narrative
0 commentsusers have commented on this narrative
0 likesusers have liked this narrative
IN

IncomeAssets on Pulse Seismic ·
Watch Pulse Seismic Outperform with 13.6% Revenue Growth in the Coming Years
Fair Value:CA$4.4727.3% undervalued
3 followersusers have followed this narrative
0 commentsusers have commented on this narrative
0 likesusers have liked this narrative
VL

Vladislav on Galleon Gold ·
Significantly undervalued gold explorer in Timmins, finally getting traction
Fair Value:CA$481.5% undervalued
7 followersusers have followed this narrative
0 commentsusers have commented on this narrative
0 likesusers have liked this narrative
Popular Narratives
TH


TheWallstreetKing on MicroVision ·
MicroVision will explode future revenue by 380.37% with a vision towards success
Fair Value:US$6098.5% undervalued
116 followersusers have followed this narrative
11 commentsusers have commented on this narrative
22 likesusers have liked this narrative
AN


AnalystConsensusTarget on NVIDIA ·
NVDA: Expanding AI Demand Will Drive Major Data Center Investments Through 2026
Fair Value:US$250.3927.2% undervalued
957 followersusers have followed this narrative
6 commentsusers have commented on this narrative
25 likesusers have liked this narrative
RO
RockeTeller on Santacruz Silver Mining ·
Crazy Undervalued 42 Baggers Silver Play (Active & Running Mine)
Fair Value:CA$8696.7% undervalued
51 followersusers have followed this narrative
6 commentsusers have commented on this narrative
16 likesusers have liked this narrative

