
Advertisement
- Malaysia
- /
- Semiconductors
- /
- KLSE:VIS
Visdynamics Holdings Berhad (KLSE:VIS) Is Reinvesting At Lower Rates Of Return
If you're looking for a multi-bagger, there's a few things to keep an eye out for. Amongst other things, we'll want to see two things; firstly, a growing return on capital employed (ROCE) and secondly, an expansion in the company's amount of capital employed. Put simply, these types of businesses are compounding machines, meaning they are continually reinvesting their earnings at ever-higher rates of return. However, after briefly looking over the numbers, we don't think Visdynamics Holdings Berhad (KLSE:VIS) has the makings of a multi-bagger going forward, but let's have a look at why that may be.
Return On Capital Employed (ROCE): What Is It?
If you haven't worked with ROCE before, it measures the 'return' (pre-tax profit) a company generates from capital employed in its business. To calculate this metric for Visdynamics Holdings Berhad, this is the formula:
Return on Capital Employed = Earnings Before Interest and Tax (EBIT) ÷ (Total Assets - Current Liabilities)
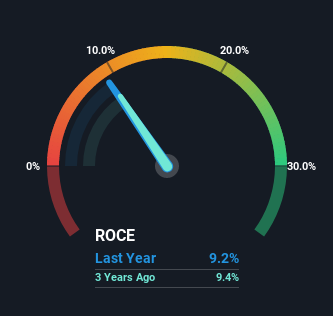
0.092 = RM5.9m ÷ (RM76m - RM13m) (Based on the trailing twelve months to January 2023).
Therefore, Visdynamics Holdings Berhad has an ROCE of 9.2%. Ultimately, that's a low return and it under-performs the Semiconductor industry average of 14%.
View our latest analysis for Visdynamics Holdings Berhad
While the past is not representative of the future, it can be helpful to know how a company has performed historically, which is why we have this chart above. If you'd like to look at how Visdynamics Holdings Berhad has performed in the past in other metrics, you can view this free graph of past earnings, revenue and cash flow.
So How Is Visdynamics Holdings Berhad's ROCE Trending?
On the surface, the trend of ROCE at Visdynamics Holdings Berhad doesn't inspire confidence. Over the last five years, returns on capital have decreased to 9.2% from 21% five years ago. And considering revenue has dropped while employing more capital, we'd be cautious. If this were to continue, you might be looking at a company that is trying to reinvest for growth but is actually losing market share since sales haven't increased.
On a side note, Visdynamics Holdings Berhad has done well to pay down its current liabilities to 17% of total assets. That could partly explain why the ROCE has dropped. Effectively this means their suppliers or short-term creditors are funding less of the business, which reduces some elements of risk. Some would claim this reduces the business' efficiency at generating ROCE since it is now funding more of the operations with its own money.
In Conclusion...
We're a bit apprehensive about Visdynamics Holdings Berhad because despite more capital being deployed in the business, returns on that capital and sales have both fallen. But investors must be expecting an improvement of sorts because over the last five yearsthe stock has delivered a respectable 81% return. Regardless, we don't feel too comfortable with the fundamentals so we'd be steering clear of this stock for now.
If you'd like to know about the risks facing Visdynamics Holdings Berhad, we've discovered 3 warning signs that you should be aware of.
For those who like to invest in solid companies, check out this free list of companies with solid balance sheets and high returns on equity.
New: Manage All Your Stock Portfolios in One Place
We've created the ultimate portfolio companion for stock investors, and it's free.
• Connect an unlimited number of Portfolios and see your total in one currency
• Be alerted to new Warning Signs or Risks via email or mobile
• Track the Fair Value of your stocks
Have feedback on this article? Concerned about the content? Get in touch with us directly. Alternatively, email editorial-team (at) simplywallst.com.
This article by Simply Wall St is general in nature. We provide commentary based on historical data and analyst forecasts only using an unbiased methodology and our articles are not intended to be financial advice. It does not constitute a recommendation to buy or sell any stock, and does not take account of your objectives, or your financial situation. We aim to bring you long-term focused analysis driven by fundamental data. Note that our analysis may not factor in the latest price-sensitive company announcements or qualitative material. Simply Wall St has no position in any stocks mentioned.
About KLSE:VIS
Visdynamics Holdings Berhad
Engages in the research and development, design, assembly, and tuning of test and backend equipment in the automated test equipment industry for semiconductors and non-semiconductors in Malaysia, South East Asia, North Asia, and internationally.
Flawless balance sheet with moderate risk.
Market Insights

Advertisement
Community Narratives
MicroVision will explode future revenue by 380.37% with a vision towards success
Fair Value US$60|98.4% undervalued
TH
Community Contributor
The Indispensable Artery for a New North American Economy
Fair Value CA$132.87|0.8% undervalued
TI
Community Contributor
Recently Updated Narratives
RE

RecMag on Proximus ·
Proximus: The State-Backed Backup Plan with 7% Gross Yield and 15% Currency Upside.
Fair Value:€17.1359.3% undervalued
29 followersusers have followed this narrative
0 commentsusers have commented on this narrative
0 likesusers have liked this narrative
SW

swift11 on DXC Technology ·
CEO: We are winners in the long term in the AI world
Fair Value:US$17.4624.9% undervalued
1 followerusers have followed this narrative
0 commentsusers have commented on this narrative
0 likesusers have liked this narrative
AL

AlexLovell on Rocket Lab ·
Early mover in a fast growing industry. Likely to experience share price volatility as they scale
Fair Value:US$16.25158.0% overvalued
2 followersusers have followed this narrative
0 commentsusers have commented on this narrative
0 likesusers have liked this narrative
Popular Narratives
TH

TheWallstreetKing on MicroVision ·
MicroVision will explode future revenue by 380.37% with a vision towards success
Fair Value:US$6098.4% undervalued
99 followersusers have followed this narrative
10 commentsusers have commented on this narrative
19 likesusers have liked this narrative
OS


oscargarcia on Alphabet ·
The company that turned a verb into a global necessity and basically runs the modern internet, digital ads, smartphones, maps, and AI.
Fair Value:US$3405.9% undervalued
137 followersusers have followed this narrative
6 commentsusers have commented on this narrative
18 likesusers have liked this narrative
AN


AnalystConsensusTarget on NVIDIA ·
NVDA: Expanding AI Demand Will Drive Major Data Center Investments Through 2026
Fair Value:US$232.7922.6% undervalued
929 followersusers have followed this narrative
6 commentsusers have commented on this narrative
22 likesusers have liked this narrative