
Advertisement
- Malaysia
- /
- Semiconductors
- /
- KLSE:MPI
Pulling back 6.9% this week, Malaysian Pacific Industries Berhad's KLSE:MPI) five-year decline in earnings may be coming into investors focus
Malaysian Pacific Industries Berhad (KLSE:MPI) shareholders have seen the share price descend 12% over the month. But that doesn't undermine the fantastic longer term performance (measured over five years). To be precise, the stock price is 305% higher than it was five years ago, a wonderful performance by any measure. Arguably, the recent fall is to be expected after such a strong rise. Only time will tell if there is still too much optimism currently reflected in the share price.
While this past week has detracted from the company's five-year return, let's look at the recent trends of the underlying business and see if the gains have been in alignment.
View our latest analysis for Malaysian Pacific Industries Berhad
In his essay The Superinvestors of Graham-and-Doddsville Warren Buffett described how share prices do not always rationally reflect the value of a business. One way to examine how market sentiment has changed over time is to look at the interaction between a company's share price and its earnings per share (EPS).
During five years of share price growth, Malaysian Pacific Industries Berhad actually saw its EPS drop 9.0% per year.
Essentially, it doesn't seem likely that investors are focused on EPS. Because earnings per share don't seem to match up with the share price, we'll take a look at other metrics instead.
The modest 1.4% dividend yield is unlikely to be propping up the share price. In contrast revenue growth of 8.9% per year is probably viewed as evidence that Malaysian Pacific Industries Berhad is growing, a real positive. It's quite possible that management are prioritizing revenue growth over EPS growth at the moment.
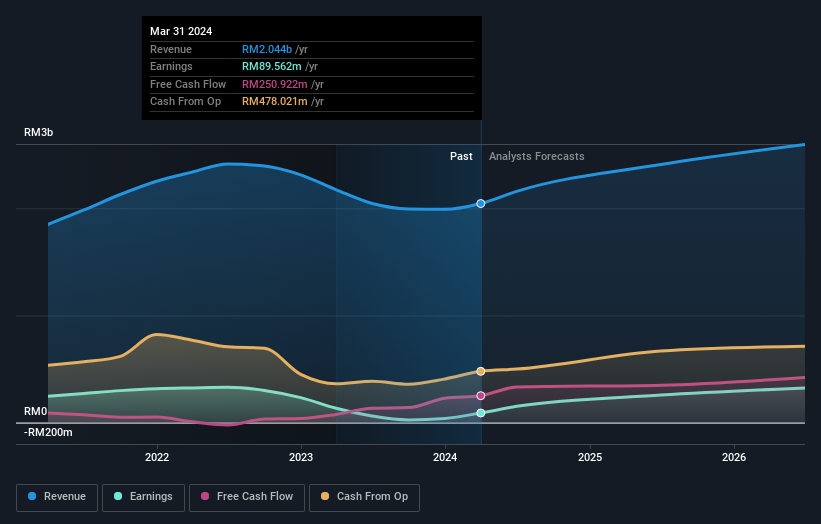
The company's revenue and earnings (over time) are depicted in the image below (click to see the exact numbers).
Take a more thorough look at Malaysian Pacific Industries Berhad's financial health with this free report on its balance sheet.
What About Dividends?
As well as measuring the share price return, investors should also consider the total shareholder return (TSR). The TSR is a return calculation that accounts for the value of cash dividends (assuming that any dividend received was reinvested) and the calculated value of any discounted capital raisings and spin-offs. So for companies that pay a generous dividend, the TSR is often a lot higher than the share price return. As it happens, Malaysian Pacific Industries Berhad's TSR for the last 5 years was 333%, which exceeds the share price return mentioned earlier. And there's no prize for guessing that the dividend payments largely explain the divergence!
A Different Perspective
It's good to see that Malaysian Pacific Industries Berhad has rewarded shareholders with a total shareholder return of 26% in the last twelve months. And that does include the dividend. However, that falls short of the 34% TSR per annum it has made for shareholders, each year, over five years. Before forming an opinion on Malaysian Pacific Industries Berhad you might want to consider these 3 valuation metrics.
For those who like to find winning investments this free list of undervalued companies with recent insider purchasing, could be just the ticket.
Please note, the market returns quoted in this article reflect the market weighted average returns of stocks that currently trade on Malaysian exchanges.
New: Manage All Your Stock Portfolios in One Place
We've created the ultimate portfolio companion for stock investors, and it's free.
• Connect an unlimited number of Portfolios and see your total in one currency
• Be alerted to new Warning Signs or Risks via email or mobile
• Track the Fair Value of your stocks
Have feedback on this article? Concerned about the content? Get in touch with us directly. Alternatively, email editorial-team (at) simplywallst.com.
This article by Simply Wall St is general in nature. We provide commentary based on historical data and analyst forecasts only using an unbiased methodology and our articles are not intended to be financial advice. It does not constitute a recommendation to buy or sell any stock, and does not take account of your objectives, or your financial situation. We aim to bring you long-term focused analysis driven by fundamental data. Note that our analysis may not factor in the latest price-sensitive company announcements or qualitative material. Simply Wall St has no position in any stocks mentioned.
Have feedback on this article? Concerned about the content? Get in touch with us directly. Alternatively, email editorial-team@simplywallst.com
About KLSE:MPI
Malaysian Pacific Industries Berhad
An investment holding company, engages in the manufacturing, assembling, testing, marketing, and sale of integrated circuits, semiconductor devices, electronic components, and lead frames.
Excellent balance sheet and slightly overvalued.
Market Insights

Advertisement
Community Narratives
MINISO's fair value is projected at 26.69 with an anticipated PE ratio shift of 20x
Fair Value US$24.03|11.0% undervalued
BE
Community Contributor
Procter & Gamble: A Dividend Giant Facing Slowing Growth
Fair Value US$119.81|23.3% overvalued
AN
Community Contributor
Eli Lilly's Future Growth Driven by Tirzepatide and Favorable Market Conditions
Fair Value US$1.19k|13.8% undervalued
EA
Community Contributor