
Advertisement
- Malaysia
- /
- Semiconductors
- /
- KLSE:MPI
Malaysian Pacific Industries Berhad's (KLSE:MPI) Shares Bounce 27% But Its Business Still Trails The Industry
Malaysian Pacific Industries Berhad (KLSE:MPI) shares have continued their recent momentum with a 27% gain in the last month alone. Looking back a bit further, it's encouraging to see the stock is up 56% in the last year.
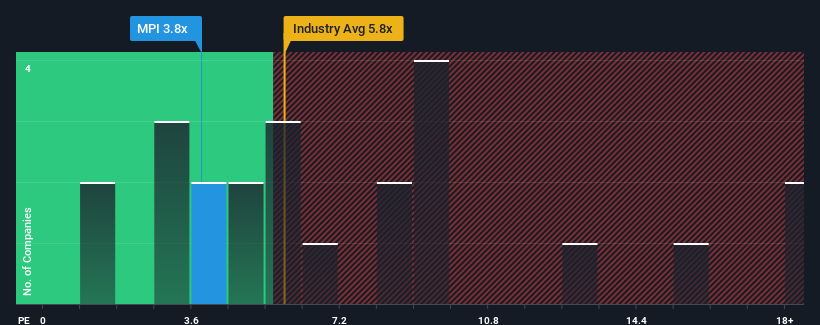
In spite of the firm bounce in price, Malaysian Pacific Industries Berhad may still be sending buy signals at present with its price-to-sales (or "P/S") ratio of 3.8x, considering almost half of all companies in the Semiconductor industry in Malaysia have P/S ratios greater than 5.8x and even P/S higher than 10x aren't out of the ordinary. Nonetheless, we'd need to dig a little deeper to determine if there is a rational basis for the reduced P/S.
View our latest analysis for Malaysian Pacific Industries Berhad
What Does Malaysian Pacific Industries Berhad's Recent Performance Look Like?
Malaysian Pacific Industries Berhad's negative revenue growth of late has neither been better nor worse than most other companies. It might be that many expect the company's revenue performance to degrade further, which has repressed the P/S. You'd much rather the company continue improving its revenue if you still believe in the business. At the very least, you'd be hoping that revenue doesn't fall off a cliff if your plan is to pick up some stock while it's out of favour.
Want the full picture on analyst estimates for the company? Then our free report on Malaysian Pacific Industries Berhad will help you uncover what's on the horizon.Do Revenue Forecasts Match The Low P/S Ratio?
In order to justify its P/S ratio, Malaysian Pacific Industries Berhad would need to produce sluggish growth that's trailing the industry.
Taking a look back first, the company's revenue growth last year wasn't something to get excited about as it posted a disappointing decline of 5.9%. Regardless, revenue has managed to lift by a handy 10% in aggregate from three years ago, thanks to the earlier period of growth. So we can start by confirming that the company has generally done a good job of growing revenue over that time, even though it had some hiccups along the way.
Shifting to the future, estimates from the six analysts covering the company suggest revenue should grow by 12% over the next year. Meanwhile, the rest of the industry is forecast to expand by 22%, which is noticeably more attractive.
With this information, we can see why Malaysian Pacific Industries Berhad is trading at a P/S lower than the industry. Apparently many shareholders weren't comfortable holding on while the company is potentially eyeing a less prosperous future.
The Key Takeaway
Despite Malaysian Pacific Industries Berhad's share price climbing recently, its P/S still lags most other companies. We'd say the price-to-sales ratio's power isn't primarily as a valuation instrument but rather to gauge current investor sentiment and future expectations.
As expected, our analysis of Malaysian Pacific Industries Berhad's analyst forecasts confirms that the company's underwhelming revenue outlook is a major contributor to its low P/S. Shareholders' pessimism on the revenue prospects for the company seems to be the main contributor to the depressed P/S. The company will need a change of fortune to justify the P/S rising higher in the future.
The company's balance sheet is another key area for risk analysis. Take a look at our free balance sheet analysis for Malaysian Pacific Industries Berhad with six simple checks on some of these key factors.
If these risks are making you reconsider your opinion on Malaysian Pacific Industries Berhad, explore our interactive list of high quality stocks to get an idea of what else is out there.
New: Manage All Your Stock Portfolios in One Place
We've created the ultimate portfolio companion for stock investors, and it's free.
• Connect an unlimited number of Portfolios and see your total in one currency
• Be alerted to new Warning Signs or Risks via email or mobile
• Track the Fair Value of your stocks
Have feedback on this article? Concerned about the content? Get in touch with us directly. Alternatively, email editorial-team (at) simplywallst.com.
This article by Simply Wall St is general in nature. We provide commentary based on historical data and analyst forecasts only using an unbiased methodology and our articles are not intended to be financial advice. It does not constitute a recommendation to buy or sell any stock, and does not take account of your objectives, or your financial situation. We aim to bring you long-term focused analysis driven by fundamental data. Note that our analysis may not factor in the latest price-sensitive company announcements or qualitative material. Simply Wall St has no position in any stocks mentioned.
About KLSE:MPI
Malaysian Pacific Industries Berhad
An investment holding company, engages in the manufacture, assemble, test, and sale of integrated circuits, semiconductor devices, electronic components, and lead frames in Asia, the United States, and Europe.
Excellent balance sheet and overvalued.
Market Insights

Advertisement
Community Narratives
The Next Phase of Energy Storage: How NeoVolta Is Tackling America’s Power Crunch
Fair Value US$7.50|35.2% undervalued
MA
Community Contributor
Why EnSilica is Worth Possibly 13x its Current Price
Fair Value UK£5.00|89.8% undervalued
DO
Community Contributor
M&A Activity, Industry Diversification & A Defense Contract Monopoly Will Push BWXT For Healthy Long-Term Growth
Fair Value US$220.00|15.6% undervalued
CL
Community Contributor
A case for Cassiar Gold Corp (TSXV: GLDC) to reach CAD$8-10 before 2030 (X30-37)
Fair Value CA$10.00|97.1% undervalued
AG
Community Contributor