
Advertisement
- Malaysia
- /
- Specialty Stores
- /
- KLSE:KAMDAR
Optimistic Investors Push Kamdar Group (M) Berhad (KLSE:KAMDAR) Shares Up 28% But Growth Is Lacking
Kamdar Group (M) Berhad (KLSE:KAMDAR) shareholders would be excited to see that the share price has had a great month, posting a 28% gain and recovering from prior weakness. Taking a wider view, although not as strong as the last month, the full year gain of 14% is also fairly reasonable.
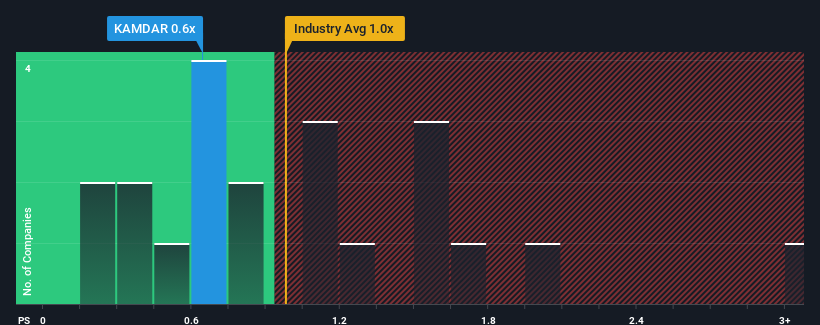
In spite of the firm bounce in price, it's still not a stretch to say that Kamdar Group (M) Berhad's price-to-sales (or "P/S") ratio of 0.6x right now seems quite "middle-of-the-road" compared to the Specialty Retail industry in Malaysia, where the median P/S ratio is around 1x. Although, it's not wise to simply ignore the P/S without explanation as investors may be disregarding a distinct opportunity or a costly mistake.
Check out our latest analysis for Kamdar Group (M) Berhad
What Does Kamdar Group (M) Berhad's Recent Performance Look Like?
For instance, Kamdar Group (M) Berhad's receding revenue in recent times would have to be some food for thought. It might be that many expect the company to put the disappointing revenue performance behind them over the coming period, which has kept the P/S from falling. If you like the company, you'd at least be hoping this is the case so that you could potentially pick up some stock while it's not quite in favour.
Want the full picture on earnings, revenue and cash flow for the company? Then our free report on Kamdar Group (M) Berhad will help you shine a light on its historical performance.Is There Some Revenue Growth Forecasted For Kamdar Group (M) Berhad?
There's an inherent assumption that a company should be matching the industry for P/S ratios like Kamdar Group (M) Berhad's to be considered reasonable.
Taking a look back first, the company's revenue growth last year wasn't something to get excited about as it posted a disappointing decline of 15%. The last three years don't look nice either as the company has shrunk revenue by 15% in aggregate. So unfortunately, we have to acknowledge that the company has not done a great job of growing revenue over that time.
In contrast to the company, the rest of the industry is expected to grow by 11% over the next year, which really puts the company's recent medium-term revenue decline into perspective.
With this information, we find it concerning that Kamdar Group (M) Berhad is trading at a fairly similar P/S compared to the industry. It seems most investors are ignoring the recent poor growth rate and are hoping for a turnaround in the company's business prospects. Only the boldest would assume these prices are sustainable as a continuation of recent revenue trends is likely to weigh on the share price eventually.
What Does Kamdar Group (M) Berhad's P/S Mean For Investors?
Its shares have lifted substantially and now Kamdar Group (M) Berhad's P/S is back within range of the industry median. It's argued the price-to-sales ratio is an inferior measure of value within certain industries, but it can be a powerful business sentiment indicator.
Our look at Kamdar Group (M) Berhad revealed its shrinking revenues over the medium-term haven't impacted the P/S as much as we anticipated, given the industry is set to grow. When we see revenue heading backwards in the context of growing industry forecasts, it'd make sense to expect a possible share price decline on the horizon, sending the moderate P/S lower. Unless the recent medium-term conditions improve markedly, investors will have a hard time accepting the share price as fair value.
Don't forget that there may be other risks. For instance, we've identified 2 warning signs for Kamdar Group (M) Berhad that you should be aware of.
It's important to make sure you look for a great company, not just the first idea you come across. So if growing profitability aligns with your idea of a great company, take a peek at this free list of interesting companies with strong recent earnings growth (and a low P/E).
Valuation is complex, but we're here to simplify it.
Discover if Kamdar Group (M) Berhad might be undervalued or overvalued with our detailed analysis, featuring fair value estimates, potential risks, dividends, insider trades, and its financial condition.
Access Free AnalysisHave feedback on this article? Concerned about the content? Get in touch with us directly. Alternatively, email editorial-team (at) simplywallst.com.
This article by Simply Wall St is general in nature. We provide commentary based on historical data and analyst forecasts only using an unbiased methodology and our articles are not intended to be financial advice. It does not constitute a recommendation to buy or sell any stock, and does not take account of your objectives, or your financial situation. We aim to bring you long-term focused analysis driven by fundamental data. Note that our analysis may not factor in the latest price-sensitive company announcements or qualitative material. Simply Wall St has no position in any stocks mentioned.
About KLSE:KAMDAR
Kamdar Group (M) Berhad
An investment holding company, engages in the import, export, retail, and wholesale of textile and textile-based products in Malaysia.
Flawless balance sheet with low risk.
Market Insights

Advertisement
Community Narratives
Finding The True Value Of A Logistics Powerhouse
Fair Value US$95.21|7.5% undervalued
NV
Community Contributor
Paradigm Biopharmaceuticals Will Lead Osteoarthritis Treatment with Zilosul's FDA Success
Fair Value AU$5.50|91.8% undervalued
AM
Community Contributor
Barrick Mining (ABX:CA): A Gold Hedge against a U.S. Shutdown
Fair Value CA$60.00|26.4% undervalued
GM
Community Contributor