
Advertisement
- Malaysia
- /
- Real Estate
- /
- KLSE:IOIPG
Here's Why IOI Properties Group Berhad (KLSE:IOIPG) Has A Meaningful Debt Burden
Howard Marks put it nicely when he said that, rather than worrying about share price volatility, 'The possibility of permanent loss is the risk I worry about... and every practical investor I know worries about.' So it might be obvious that you need to consider debt, when you think about how risky any given stock is, because too much debt can sink a company. As with many other companies IOI Properties Group Berhad (KLSE:IOIPG) makes use of debt. But the more important question is: how much risk is that debt creating?
What Risk Does Debt Bring?
Generally speaking, debt only becomes a real problem when a company can't easily pay it off, either by raising capital or with its own cash flow. If things get really bad, the lenders can take control of the business. While that is not too common, we often do see indebted companies permanently diluting shareholders because lenders force them to raise capital at a distressed price. Of course, the upside of debt is that it often represents cheap capital, especially when it replaces dilution in a company with the ability to reinvest at high rates of return. When we think about a company's use of debt, we first look at cash and debt together.
See our latest analysis for IOI Properties Group Berhad
How Much Debt Does IOI Properties Group Berhad Carry?
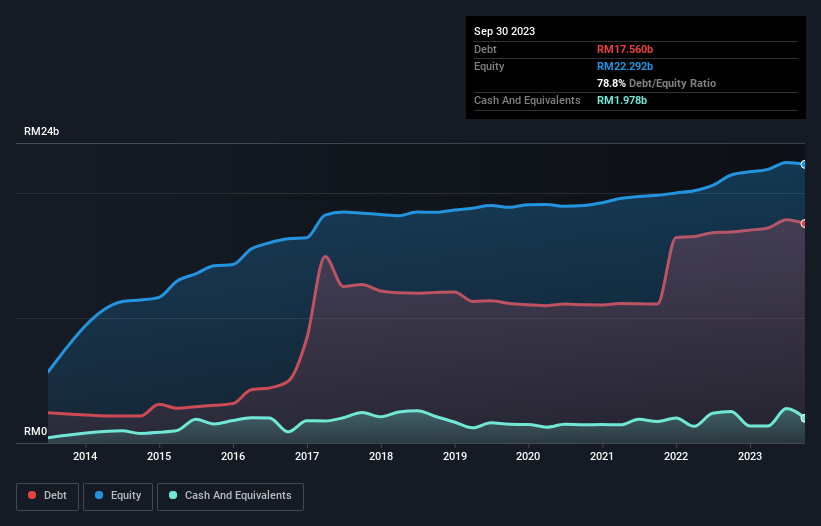
You can click the graphic below for the historical numbers, but it shows that as of September 2023 IOI Properties Group Berhad had RM17.6b of debt, an increase on RM16.9b, over one year. However, it does have RM1.98b in cash offsetting this, leading to net debt of about RM15.6b.
How Strong Is IOI Properties Group Berhad's Balance Sheet?
According to the last reported balance sheet, IOI Properties Group Berhad had liabilities of RM17.8b due within 12 months, and liabilities of RM2.25b due beyond 12 months. Offsetting this, it had RM1.98b in cash and RM635.5m in receivables that were due within 12 months. So it has liabilities totalling RM17.4b more than its cash and near-term receivables, combined.
When you consider that this deficiency exceeds the company's RM12.7b market capitalization, you might well be inclined to review the balance sheet intently. Hypothetically, extremely heavy dilution would be required if the company were forced to pay down its liabilities by raising capital at the current share price.
We use two main ratios to inform us about debt levels relative to earnings. The first is net debt divided by earnings before interest, tax, depreciation, and amortization (EBITDA), while the second is how many times its earnings before interest and tax (EBIT) covers its interest expense (or its interest cover, for short). Thus we consider debt relative to earnings both with and without depreciation and amortization expenses.
Strangely IOI Properties Group Berhad has a sky high EBITDA ratio of 18.5, implying high debt, but a strong interest coverage of 1k. So either it has access to very cheap long term debt or that interest expense is going to grow! Importantly, IOI Properties Group Berhad's EBIT fell a jaw-dropping 42% in the last twelve months. If that earnings trend continues then paying off its debt will be about as easy as herding cats on to a roller coaster. The balance sheet is clearly the area to focus on when you are analysing debt. But it is future earnings, more than anything, that will determine IOI Properties Group Berhad's ability to maintain a healthy balance sheet going forward. So if you're focused on the future you can check out this free report showing analyst profit forecasts.
Finally, a company can only pay off debt with cold hard cash, not accounting profits. So we clearly need to look at whether that EBIT is leading to corresponding free cash flow. Over the most recent three years, IOI Properties Group Berhad recorded free cash flow worth 55% of its EBIT, which is around normal, given free cash flow excludes interest and tax. This free cash flow puts the company in a good position to pay down debt, when appropriate.
Our View
To be frank both IOI Properties Group Berhad's net debt to EBITDA and its track record of (not) growing its EBIT make us rather uncomfortable with its debt levels. But at least it's pretty decent at covering its interest expense with its EBIT; that's encouraging. Overall, it seems to us that IOI Properties Group Berhad's balance sheet is really quite a risk to the business. So we're almost as wary of this stock as a hungry kitten is about falling into its owner's fish pond: once bitten, twice shy, as they say. When analysing debt levels, the balance sheet is the obvious place to start. However, not all investment risk resides within the balance sheet - far from it. These risks can be hard to spot. Every company has them, and we've spotted 2 warning signs for IOI Properties Group Berhad (of which 1 is a bit unpleasant!) you should know about.
Of course, if you're the type of investor who prefers buying stocks without the burden of debt, then don't hesitate to discover our exclusive list of net cash growth stocks, today.
New: AI Stock Screener & Alerts
Our new AI Stock Screener scans the market every day to uncover opportunities.
• Dividend Powerhouses (3%+ Yield)
• Undervalued Small Caps with Insider Buying
• High growth Tech and AI Companies
Or build your own from over 50 metrics.
Have feedback on this article? Concerned about the content? Get in touch with us directly. Alternatively, email editorial-team (at) simplywallst.com.
This article by Simply Wall St is general in nature. We provide commentary based on historical data and analyst forecasts only using an unbiased methodology and our articles are not intended to be financial advice. It does not constitute a recommendation to buy or sell any stock, and does not take account of your objectives, or your financial situation. We aim to bring you long-term focused analysis driven by fundamental data. Note that our analysis may not factor in the latest price-sensitive company announcements or qualitative material. Simply Wall St has no position in any stocks mentioned.
About KLSE:IOIPG
IOI Properties Group Berhad
An investment holding company, engages in the property development activities in Malaysia, Singapore, and the People's Republic of China.
Second-rate dividend payer with low risk.
Market Insights

Advertisement
Community Narratives
MicroVision will explode future revenue by 380.37% with a vision towards success
Fair Value US$60|98.4% undervalued
TH
Community Contributor
The Indispensable Artery for a New North American Economy
Fair Value CA$132.87|0.7% overvalued
TI
Community Contributor
Recently Updated Narratives
CE

cementafriend on Constellation Energy ·
Constellation Energy Dividends and Growth
Fair Value:US$348.054.7% overvalued
2 followersusers have followed this narrative
0 commentsusers have commented on this narrative
0 likesusers have liked this narrative
KH

Khagani on CoreWeave ·
CoreWeave's Revenue Expected to Rocket 77.88% in 5-Year Forecast
Fair Value:US$11033.5% undervalued
1 followerusers have followed this narrative
0 commentsusers have commented on this narrative
0 likesusers have liked this narrative
PO

PortfolioPlus on Bisalloy Steel Group ·
Bisalloy Steel Group will shine with a projected profit margin increase of 12.8%
Fair Value:AU$6.7118.0% undervalued
2 followersusers have followed this narrative
0 commentsusers have commented on this narrative
0 likesusers have liked this narrative
Popular Narratives
TH

TheWallstreetKing on MicroVision ·
MicroVision will explode future revenue by 380.37% with a vision towards success
Fair Value:US$6098.4% undervalued
103 followersusers have followed this narrative
10 commentsusers have commented on this narrative
20 likesusers have liked this narrative
AN


AnalystConsensusTarget on NVIDIA ·
NVDA: Expanding AI Demand Will Drive Major Data Center Investments Through 2026
Fair Value:US$250.3929.3% undervalued
936 followersusers have followed this narrative
6 commentsusers have commented on this narrative
23 likesusers have liked this narrative
OS


oscargarcia on Alphabet ·
The company that turned a verb into a global necessity and basically runs the modern internet, digital ads, smartphones, maps, and AI.
Fair Value:US$3405.8% undervalued
141 followersusers have followed this narrative
6 commentsusers have commented on this narrative
18 likesusers have liked this narrative