
Advertisement
Is Astro Malaysia Holdings Berhad (KLSE:ASTRO) Using Too Much Debt?
The external fund manager backed by Berkshire Hathaway's Charlie Munger, Li Lu, makes no bones about it when he says 'The biggest investment risk is not the volatility of prices, but whether you will suffer a permanent loss of capital.' So it might be obvious that you need to consider debt, when you think about how risky any given stock is, because too much debt can sink a company. Importantly, Astro Malaysia Holdings Berhad (KLSE:ASTRO) does carry debt. But the more important question is: how much risk is that debt creating?
We've discovered 2 warning signs about Astro Malaysia Holdings Berhad. View them for free.What Risk Does Debt Bring?
Debt is a tool to help businesses grow, but if a business is incapable of paying off its lenders, then it exists at their mercy. Part and parcel of capitalism is the process of 'creative destruction' where failed businesses are mercilessly liquidated by their bankers. However, a more usual (but still expensive) situation is where a company must dilute shareholders at a cheap share price simply to get debt under control. Having said that, the most common situation is where a company manages its debt reasonably well - and to its own advantage. The first step when considering a company's debt levels is to consider its cash and debt together.
What Is Astro Malaysia Holdings Berhad's Net Debt?
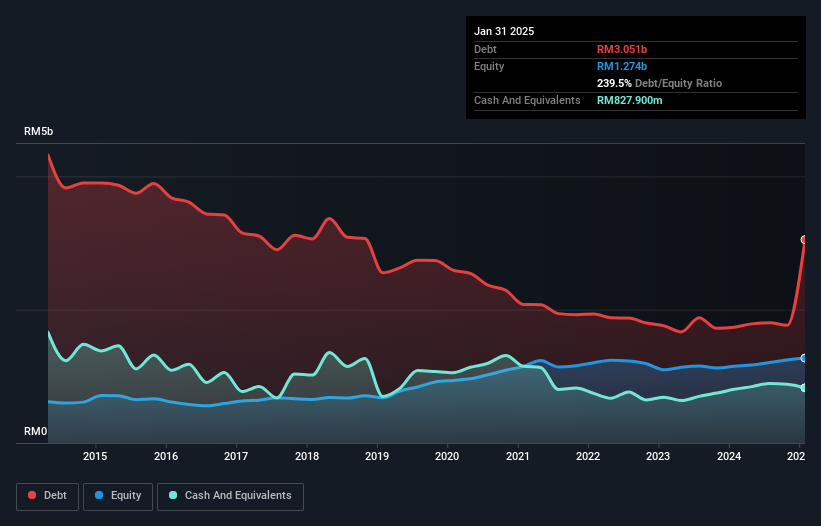
You can click the graphic below for the historical numbers, but it shows that as of January 2025 Astro Malaysia Holdings Berhad had RM3.05b of debt, an increase on RM1.74b, over one year. However, because it has a cash reserve of RM827.9m, its net debt is less, at about RM2.22b.
A Look At Astro Malaysia Holdings Berhad's Liabilities
We can see from the most recent balance sheet that Astro Malaysia Holdings Berhad had liabilities of RM1.40b falling due within a year, and liabilities of RM2.82b due beyond that. On the other hand, it had cash of RM827.9m and RM652.8m worth of receivables due within a year. So its liabilities outweigh the sum of its cash and (near-term) receivables by RM2.75b.
The deficiency here weighs heavily on the RM991.6m company itself, as if a child were struggling under the weight of an enormous back-pack full of books, his sports gear, and a trumpet. So we definitely think shareholders need to watch this one closely. After all, Astro Malaysia Holdings Berhad would likely require a major re-capitalisation if it had to pay its creditors today.
Check out our latest analysis for Astro Malaysia Holdings Berhad
We measure a company's debt load relative to its earnings power by looking at its net debt divided by its earnings before interest, tax, depreciation, and amortization (EBITDA) and by calculating how easily its earnings before interest and tax (EBIT) cover its interest expense (interest cover). Thus we consider debt relative to earnings both with and without depreciation and amortization expenses.
While Astro Malaysia Holdings Berhad's debt to EBITDA ratio (2.7) suggests that it uses some debt, its interest cover is very weak, at 1.6, suggesting high leverage. It seems that the business incurs large depreciation and amortisation charges, so maybe its debt load is heavier than it would first appear, since EBITDA is arguably a generous measure of earnings. It seems clear that the cost of borrowing money is negatively impacting returns for shareholders, of late. Even worse, Astro Malaysia Holdings Berhad saw its EBIT tank 25% over the last 12 months. If earnings continue to follow that trajectory, paying off that debt load will be harder than convincing us to run a marathon in the rain. When analysing debt levels, the balance sheet is the obvious place to start. But ultimately the future profitability of the business will decide if Astro Malaysia Holdings Berhad can strengthen its balance sheet over time. So if you want to see what the professionals think, you might find this free report on analyst profit forecasts to be interesting.
Finally, a company can only pay off debt with cold hard cash, not accounting profits. So we clearly need to look at whether that EBIT is leading to corresponding free cash flow. Happily for any shareholders, Astro Malaysia Holdings Berhad actually produced more free cash flow than EBIT over the last three years. There's nothing better than incoming cash when it comes to staying in your lenders' good graces.
Our View
On the face of it, Astro Malaysia Holdings Berhad's EBIT growth rate left us tentative about the stock, and its level of total liabilities was no more enticing than the one empty restaurant on the busiest night of the year. But on the bright side, its conversion of EBIT to free cash flow is a good sign, and makes us more optimistic. We're quite clear that we consider Astro Malaysia Holdings Berhad to be really rather risky, as a result of its balance sheet health. For this reason we're pretty cautious about the stock, and we think shareholders should keep a close eye on its liquidity. When analysing debt levels, the balance sheet is the obvious place to start. However, not all investment risk resides within the balance sheet - far from it. Be aware that Astro Malaysia Holdings Berhad is showing 2 warning signs in our investment analysis , you should know about...
If, after all that, you're more interested in a fast growing company with a rock-solid balance sheet, then check out our list of net cash growth stocks without delay.
New: Manage All Your Stock Portfolios in One Place
We've created the ultimate portfolio companion for stock investors, and it's free.
• Connect an unlimited number of Portfolios and see your total in one currency
• Be alerted to new Warning Signs or Risks via email or mobile
• Track the Fair Value of your stocks
Have feedback on this article? Concerned about the content? Get in touch with us directly. Alternatively, email editorial-team (at) simplywallst.com.
This article by Simply Wall St is general in nature. We provide commentary based on historical data and analyst forecasts only using an unbiased methodology and our articles are not intended to be financial advice. It does not constitute a recommendation to buy or sell any stock, and does not take account of your objectives, or your financial situation. We aim to bring you long-term focused analysis driven by fundamental data. Note that our analysis may not factor in the latest price-sensitive company announcements or qualitative material. Simply Wall St has no position in any stocks mentioned.
About KLSE:ASTRO
Astro Malaysia Holdings Berhad
Through its subsidiaries, operates as a content and entertainment company in Malaysia and internationally.
Undervalued with acceptable track record.
Similar Companies
Market Insights

Advertisement
Community Narratives
The Next Phase of Energy Storage: How NeoVolta Is Tackling America’s Power Crunch
Fair Value US$7.50|35.1% undervalued
MA
Community Contributor
Why EnSilica is Worth Possibly 13x its Current Price
Fair Value UK£5.00|89.8% undervalued
DO
Community Contributor
M&A Activity, Industry Diversification & A Defense Contract Monopoly Will Push BWXT For Healthy Long-Term Growth
Fair Value US$220.00|15.2% undervalued
CL
Community Contributor
A case for Cassiar Gold Corp (TSXV: GLDC) to reach CAD$8-10 before 2030 (X30-37)
Fair Value CA$10.00|96.0% undervalued
AG
Community Contributor