- Malaysia
- /
- Metals and Mining
- /
- KLSE:SMI
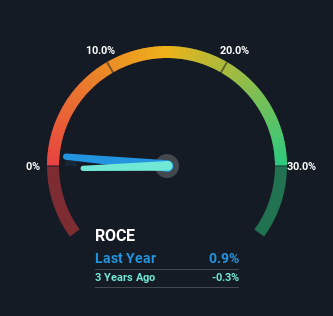
Be Wary Of South Malaysia Industries Berhad (KLSE:SMI) And Its Returns On Capital


When researching a stock for investment, what can tell us that the company is in decline? When we see a declining return on capital employed (ROCE) in conjunction with a declining base of capital employed, that's often how a mature business shows signs of aging. Ultimately this means that the company is earning less per dollar invested and on top of that, it's shrinking its base of capital employed. On that note, looking into South Malaysia Industries Berhad (KLSE:SMI), we weren't too upbeat about how things were going.
What is Return On Capital Employed (ROCE)?
Just to clarify if you're unsure, ROCE is a metric for evaluating how much pre-tax income (in percentage terms) a company earns on the capital invested in its business. Analysts use this formula to calculate it for South Malaysia Industries Berhad:
Return on Capital Employed = Earnings Before Interest and Tax (EBIT) ÷ (Total Assets - Current Liabilities)
0.0088 = RM1.4m ÷ (RM172m - RM17m) (Based on the trailing twelve months to March 2022).
So, South Malaysia Industries Berhad has an ROCE of 0.9%. Ultimately, that's a low return and it under-performs the Metals and Mining industry average of 13%.
See our latest analysis for South Malaysia Industries Berhad
While the past is not representative of the future, it can be helpful to know how a company has performed historically, which is why we have this chart above. If you want to delve into the historical earnings, revenue and cash flow of South Malaysia Industries Berhad, check out these free graphs here.
What Does the ROCE Trend For South Malaysia Industries Berhad Tell Us?
We are a bit worried about the trend of returns on capital at South Malaysia Industries Berhad. About five years ago, returns on capital were 17%, however they're now substantially lower than that as we saw above. And on the capital employed front, the business is utilizing roughly the same amount of capital as it was back then. This combination can be indicative of a mature business that still has areas to deploy capital, but the returns received aren't as high due potentially to new competition or smaller margins. If these trends continue, we wouldn't expect South Malaysia Industries Berhad to turn into a multi-bagger.
On a related note, South Malaysia Industries Berhad has decreased its current liabilities to 9.7% of total assets. So we could link some of this to the decrease in ROCE. What's more, this can reduce some aspects of risk to the business because now the company's suppliers or short-term creditors are funding less of its operations. Some would claim this reduces the business' efficiency at generating ROCE since it is now funding more of the operations with its own money.
What We Can Learn From South Malaysia Industries Berhad's ROCE
In the end, the trend of lower returns on the same amount of capital isn't typically an indication that we're looking at a growth stock. Despite the concerning underlying trends, the stock has actually gained 40% over the last five years, so it might be that the investors are expecting the trends to reverse. Regardless, we don't like the trends as they are and if they persist, we think you might find better investments elsewhere.
Since virtually every company faces some risks, it's worth knowing what they are, and we've spotted 3 warning signs for South Malaysia Industries Berhad (of which 1 makes us a bit uncomfortable!) that you should know about.
If you want to search for solid companies with great earnings, check out this free list of companies with good balance sheets and impressive returns on equity.
If you're looking to trade South Malaysia Industries Berhad, open an account with the lowest-cost platform trusted by professionals, Interactive Brokers.
With clients in over 200 countries and territories, and access to 160 markets, IBKR lets you trade stocks, options, futures, forex, bonds and funds from a single integrated account.
Enjoy no hidden fees, no account minimums, and FX conversion rates as low as 0.03%, far better than what most brokers offer.
Sponsored ContentNew: Manage All Your Stock Portfolios in One Place
We've created the ultimate portfolio companion for stock investors, and it's free.
• Connect an unlimited number of Portfolios and see your total in one currency
• Be alerted to new Warning Signs or Risks via email or mobile
• Track the Fair Value of your stocks
Have feedback on this article? Concerned about the content? Get in touch with us directly. Alternatively, email editorial-team (at) simplywallst.com.
This article by Simply Wall St is general in nature. We provide commentary based on historical data and analyst forecasts only using an unbiased methodology and our articles are not intended to be financial advice. It does not constitute a recommendation to buy or sell any stock, and does not take account of your objectives, or your financial situation. We aim to bring you long-term focused analysis driven by fundamental data. Note that our analysis may not factor in the latest price-sensitive company announcements or qualitative material. Simply Wall St has no position in any stocks mentioned.
About KLSE:SMI
South Malaysia Industries Berhad
An investment holding company, engages in the property investment, trading, and development activities in Malaysia.
Adequate balance sheet low.
Market Insights

Community Narratives

