- Malaysia
- /
- Metals and Mining
- /
- KLSE:MELEWAR
These 4 Measures Indicate That Melewar Industrial Group Berhad (KLSE:MELEWAR) Is Using Debt Extensively


Howard Marks put it nicely when he said that, rather than worrying about share price volatility, 'The possibility of permanent loss is the risk I worry about... and every practical investor I know worries about.' So it might be obvious that you need to consider debt, when you think about how risky any given stock is, because too much debt can sink a company. We can see that Melewar Industrial Group Berhad (KLSE:MELEWAR) does use debt in its business. But should shareholders be worried about its use of debt?
When Is Debt Dangerous?
Debt is a tool to help businesses grow, but if a business is incapable of paying off its lenders, then it exists at their mercy. In the worst case scenario, a company can go bankrupt if it cannot pay its creditors. While that is not too common, we often do see indebted companies permanently diluting shareholders because lenders force them to raise capital at a distressed price. Having said that, the most common situation is where a company manages its debt reasonably well - and to its own advantage. The first step when considering a company's debt levels is to consider its cash and debt together.
See our latest analysis for Melewar Industrial Group Berhad
How Much Debt Does Melewar Industrial Group Berhad Carry?
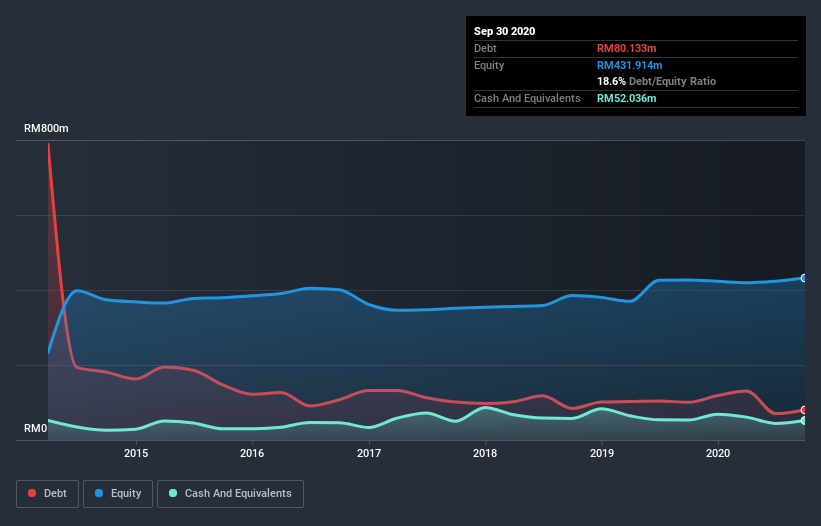
The image below, which you can click on for greater detail, shows that Melewar Industrial Group Berhad had debt of RM80.1m at the end of September 2020, a reduction from RM100.6m over a year. On the flip side, it has RM52.0m in cash leading to net debt of about RM28.1m.
A Look At Melewar Industrial Group Berhad's Liabilities
We can see from the most recent balance sheet that Melewar Industrial Group Berhad had liabilities of RM131.3m falling due within a year, and liabilities of RM75.6m due beyond that. On the other hand, it had cash of RM52.0m and RM81.4m worth of receivables due within a year. So its liabilities outweigh the sum of its cash and (near-term) receivables by RM73.4m.
Melewar Industrial Group Berhad has a market capitalization of RM179.7m, so it could very likely raise cash to ameliorate its balance sheet, if the need arose. But we definitely want to keep our eyes open to indications that its debt is bringing too much risk.
We use two main ratios to inform us about debt levels relative to earnings. The first is net debt divided by earnings before interest, tax, depreciation, and amortization (EBITDA), while the second is how many times its earnings before interest and tax (EBIT) covers its interest expense (or its interest cover, for short). Thus we consider debt relative to earnings both with and without depreciation and amortization expenses.
While Melewar Industrial Group Berhad has a quite reasonable net debt to EBITDA multiple of 1.8, its interest cover seems weak, at 0.24. In large part that's it has so much depreciation and amortisation. These charges may be non-cash, so they could be excluded when it comes to paying down debt. But the accounting charges are there for a reason -- some assets are seen to be losing value. In any case, it's safe to say the company has meaningful debt. Importantly, Melewar Industrial Group Berhad's EBIT fell a jaw-dropping 97% in the last twelve months. If that earnings trend continues then paying off its debt will be about as easy as herding cats on to a roller coaster. The balance sheet is clearly the area to focus on when you are analysing debt. But you can't view debt in total isolation; since Melewar Industrial Group Berhad will need earnings to service that debt. So if you're keen to discover more about its earnings, it might be worth checking out this graph of its long term earnings trend.
But our final consideration is also important, because a company cannot pay debt with paper profits; it needs cold hard cash. So we always check how much of that EBIT is translated into free cash flow. During the last three years, Melewar Industrial Group Berhad burned a lot of cash. While that may be a result of expenditure for growth, it does make the debt far more risky.
Our View
On the face of it, Melewar Industrial Group Berhad's conversion of EBIT to free cash flow left us tentative about the stock, and its EBIT growth rate was no more enticing than the one empty restaurant on the busiest night of the year. But at least its net debt to EBITDA is not so bad. We're quite clear that we consider Melewar Industrial Group Berhad to be really rather risky, as a result of its balance sheet health. For this reason we're pretty cautious about the stock, and we think shareholders should keep a close eye on its liquidity. When analysing debt levels, the balance sheet is the obvious place to start. However, not all investment risk resides within the balance sheet - far from it. These risks can be hard to spot. Every company has them, and we've spotted 4 warning signs for Melewar Industrial Group Berhad you should know about.
If, after all that, you're more interested in a fast growing company with a rock-solid balance sheet, then check out our list of net cash growth stocks without delay.
When trading Melewar Industrial Group Berhad or any other investment, use the platform considered by many to be the Professional's Gateway to the Worlds Market, Interactive Brokers. You get the lowest-cost* trading on stocks, options, futures, forex, bonds and funds worldwide from a single integrated account. Promoted
If you're looking to trade Melewar Industrial Group Berhad, open an account with the lowest-cost platform trusted by professionals, Interactive Brokers.
With clients in over 200 countries and territories, and access to 160 markets, IBKR lets you trade stocks, options, futures, forex, bonds and funds from a single integrated account.
Enjoy no hidden fees, no account minimums, and FX conversion rates as low as 0.03%, far better than what most brokers offer.
Sponsored ContentNew: Manage All Your Stock Portfolios in One Place
We've created the ultimate portfolio companion for stock investors, and it's free.
• Connect an unlimited number of Portfolios and see your total in one currency
• Be alerted to new Warning Signs or Risks via email or mobile
• Track the Fair Value of your stocks
This article by Simply Wall St is general in nature. It does not constitute a recommendation to buy or sell any stock, and does not take account of your objectives, or your financial situation. We aim to bring you long-term focused analysis driven by fundamental data. Note that our analysis may not factor in the latest price-sensitive company announcements or qualitative material. Simply Wall St has no position in any stocks mentioned.
*Interactive Brokers Rated Lowest Cost Broker by StockBrokers.com Annual Online Review 2020
Have feedback on this article? Concerned about the content? Get in touch with us directly. Alternatively, email editorial-team (at) simplywallst.com.
About KLSE:MELEWAR
Melewar Industrial Group Berhad
An investment holding company, engages in manufacturing and trading of steel and iron products in Malaysia and internationally.
Excellent balance sheet with acceptable track record.
Similar Companies
Market Insights

Community Narratives

