BP Plastics Holding Bhd (KLSE:BPPLAS) jumps 11% this week, though earnings growth is still tracking behind five-year shareholder returns


Generally speaking the aim of active stock picking is to find companies that provide returns that are superior to the market average. And the truth is, you can make significant gains if you buy good quality businesses at the right price. To wit, the BP Plastics Holding Bhd share price has climbed 95% in five years, easily topping the market return of 2.9% (ignoring dividends). However, more recent returns haven't been as impressive as that, with the stock returning just 25% in the last year , including dividends .
Since it's been a strong week for BP Plastics Holding Bhd shareholders, let's have a look at trend of the longer term fundamentals.
View our latest analysis for BP Plastics Holding Bhd
To quote Buffett, 'Ships will sail around the world but the Flat Earth Society will flourish. There will continue to be wide discrepancies between price and value in the marketplace...' One imperfect but simple way to consider how the market perception of a company has shifted is to compare the change in the earnings per share (EPS) with the share price movement.
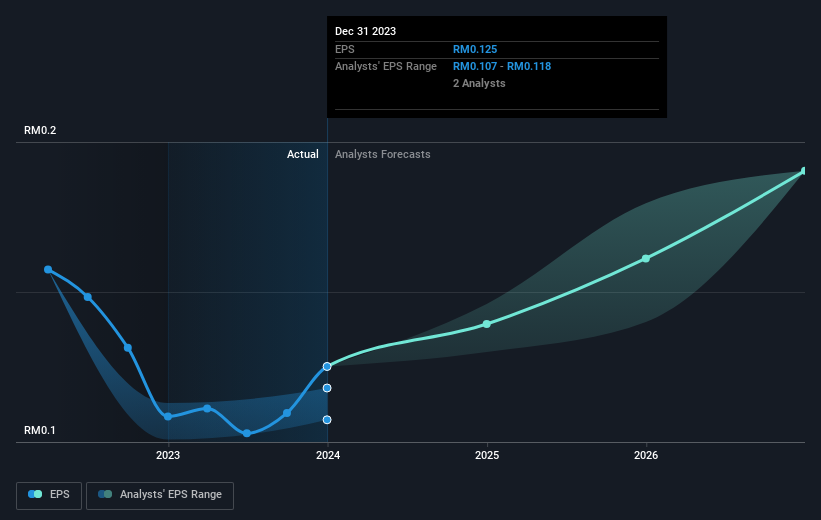
During five years of share price growth, BP Plastics Holding Bhd achieved compound earnings per share (EPS) growth of 11% per year. This EPS growth is lower than the 14% average annual increase in the share price. This suggests that market participants hold the company in higher regard, these days. And that's hardly shocking given the track record of growth.
You can see below how EPS has changed over time (discover the exact values by clicking on the image).
We know that BP Plastics Holding Bhd has improved its bottom line lately, but is it going to grow revenue? Check if analysts think BP Plastics Holding Bhd will grow revenue in the future.
What About Dividends?
It is important to consider the total shareholder return, as well as the share price return, for any given stock. The TSR is a return calculation that accounts for the value of cash dividends (assuming that any dividend received was reinvested) and the calculated value of any discounted capital raisings and spin-offs. It's fair to say that the TSR gives a more complete picture for stocks that pay a dividend. In the case of BP Plastics Holding Bhd, it has a TSR of 154% for the last 5 years. That exceeds its share price return that we previously mentioned. This is largely a result of its dividend payments!
A Different Perspective
It's good to see that BP Plastics Holding Bhd has rewarded shareholders with a total shareholder return of 25% in the last twelve months. Of course, that includes the dividend. That's better than the annualised return of 20% over half a decade, implying that the company is doing better recently. Someone with an optimistic perspective could view the recent improvement in TSR as indicating that the business itself is getting better with time. I find it very interesting to look at share price over the long term as a proxy for business performance. But to truly gain insight, we need to consider other information, too. Consider risks, for instance. Every company has them, and we've spotted 2 warning signs for BP Plastics Holding Bhd you should know about.
If you are like me, then you will not want to miss this free list of growing companies that insiders are buying.
Please note, the market returns quoted in this article reflect the market weighted average returns of stocks that currently trade on Malaysian exchanges.
Valuation is complex, but we're here to simplify it.
Discover if BP Plastics Holding Bhd might be undervalued or overvalued with our detailed analysis, featuring fair value estimates, potential risks, dividends, insider trades, and its financial condition.
Access Free AnalysisHave feedback on this article? Concerned about the content? Get in touch with us directly. Alternatively, email editorial-team (at) simplywallst.com.
This article by Simply Wall St is general in nature. We provide commentary based on historical data and analyst forecasts only using an unbiased methodology and our articles are not intended to be financial advice. It does not constitute a recommendation to buy or sell any stock, and does not take account of your objectives, or your financial situation. We aim to bring you long-term focused analysis driven by fundamental data. Note that our analysis may not factor in the latest price-sensitive company announcements or qualitative material. Simply Wall St has no position in any stocks mentioned.
About KLSE:BPPLAS
BP Plastics Holding Bhd
An investment holding company, engages in the manufacturing and trading of plastic products in Malaysia, rest of Asia, and internationally.
Flawless balance sheet and fair value.
Market Insights

Community Narratives


