TPC Plus Berhad's (KLSE:TPC) Returns On Capital Not Reflecting Well On The Business


To avoid investing in a business that's in decline, there's a few financial metrics that can provide early indications of aging. Typically, we'll see the trend of both return on capital employed (ROCE) declining and this usually coincides with a decreasing amount of capital employed. This reveals that the company isn't compounding shareholder wealth because returns are falling and its net asset base is shrinking. So after glancing at the trends within TPC Plus Berhad (KLSE:TPC), we weren't too hopeful.
Understanding Return On Capital Employed (ROCE)
If you haven't worked with ROCE before, it measures the 'return' (pre-tax profit) a company generates from capital employed in its business. Analysts use this formula to calculate it for TPC Plus Berhad:
Return on Capital Employed = Earnings Before Interest and Tax (EBIT) ÷ (Total Assets - Current Liabilities)
0.018 = RM1.6m ÷ (RM242m - RM153m) (Based on the trailing twelve months to March 2023).
So, TPC Plus Berhad has an ROCE of 1.8%. In absolute terms, that's a low return and it also under-performs the Food industry average of 8.5%.
Check out our latest analysis for TPC Plus Berhad
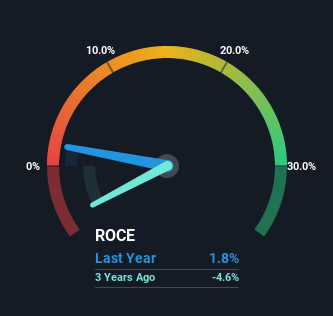
Historical performance is a great place to start when researching a stock so above you can see the gauge for TPC Plus Berhad's ROCE against it's prior returns. If you'd like to look at how TPC Plus Berhad has performed in the past in other metrics, you can view this free graph of past earnings, revenue and cash flow.
SWOT Analysis for TPC Plus Berhad
- Debt is well covered by cash flow.
- Interest payments on debt are not well covered.
- Trading below our estimate of fair value by more than 20%.
- Lack of analyst coverage makes it difficult to determine TPC's earnings prospects.
- No apparent threats visible for TPC.
What The Trend Of ROCE Can Tell Us
The trend of returns that TPC Plus Berhad is generating are raising some concerns. To be more specific, today's ROCE was 7.0% five years ago but has since fallen to 1.8%. On top of that, the business is utilizing 23% less capital within its operations. The combination of lower ROCE and less capital employed can indicate that a business is likely to be facing some competitive headwinds or seeing an erosion to its moat. Typically businesses that exhibit these characteristics aren't the ones that tend to multiply over the long term, because statistically speaking, they've already gone through the growth phase of their life cycle.
On a side note, TPC Plus Berhad's current liabilities have increased over the last five years to 63% of total assets, effectively distorting the ROCE to some degree. If current liabilities hadn't increased as much as they did, the ROCE could actually be even lower. And with current liabilities at these levels, suppliers or short-term creditors are effectively funding a large part of the business, which can introduce some risks.
The Key Takeaway
To see TPC Plus Berhad reducing the capital employed in the business in tandem with diminishing returns, is concerning. Investors haven't taken kindly to these developments, since the stock has declined 44% from where it was five years ago. Unless there is a shift to a more positive trajectory in these metrics, we would look elsewhere.
If you'd like to know more about TPC Plus Berhad, we've spotted 2 warning signs, and 1 of them doesn't sit too well with us.
While TPC Plus Berhad isn't earning the highest return, check out this free list of companies that are earning high returns on equity with solid balance sheets.
Valuation is complex, but we're here to simplify it.
Discover if TPC Plus Berhad might be undervalued or overvalued with our detailed analysis, featuring fair value estimates, potential risks, dividends, insider trades, and its financial condition.
Access Free AnalysisHave feedback on this article? Concerned about the content? Get in touch with us directly. Alternatively, email editorial-team (at) simplywallst.com.
This article by Simply Wall St is general in nature. We provide commentary based on historical data and analyst forecasts only using an unbiased methodology and our articles are not intended to be financial advice. It does not constitute a recommendation to buy or sell any stock, and does not take account of your objectives, or your financial situation. We aim to bring you long-term focused analysis driven by fundamental data. Note that our analysis may not factor in the latest price-sensitive company announcements or qualitative material. Simply Wall St has no position in any stocks mentioned.
About KLSE:TPC
TPC Plus Berhad
An investment holding company, engages in the poultry farming business in Malaysia.
Excellent balance sheet, good value and pays a dividend.
Market Insights

Community Narratives

