
Advertisement
Capital Allocation Trends At Teck Guan Perdana Berhad (KLSE:TECGUAN) Aren't Ideal

When we're researching a company, it's sometimes hard to find the warning signs, but there are some financial metrics that can help spot trouble early. A business that's potentially in decline often shows two trends, a return on capital employed (ROCE) that's declining, and a base of capital employed that's also declining. This reveals that the company isn't compounding shareholder wealth because returns are falling and its net asset base is shrinking. So after we looked into Teck Guan Perdana Berhad (KLSE:TECGUAN), the trends above didn't look too great.
Return On Capital Employed (ROCE): What is it?
Just to clarify if you're unsure, ROCE is a metric for evaluating how much pre-tax income (in percentage terms) a company earns on the capital invested in its business. The formula for this calculation on Teck Guan Perdana Berhad is:
Return on Capital Employed = Earnings Before Interest and Tax (EBIT) ÷ (Total Assets - Current Liabilities)
0.10 = RM9.2m ÷ (RM198m - RM110m) (Based on the trailing twelve months to October 2021).
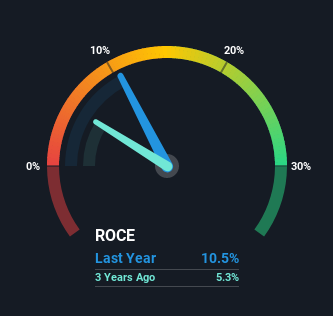
So, Teck Guan Perdana Berhad has an ROCE of 10%. On its own, that's a standard return, however it's much better than the 8.6% generated by the Food industry.
View our latest analysis for Teck Guan Perdana Berhad
While the past is not representative of the future, it can be helpful to know how a company has performed historically, which is why we have this chart above. If you'd like to look at how Teck Guan Perdana Berhad has performed in the past in other metrics, you can view this free graph of past earnings, revenue and cash flow.
How Are Returns Trending?
In terms of Teck Guan Perdana Berhad's historical ROCE trend, it isn't fantastic. Unfortunately, returns have declined substantially over the last five years to the 10% we see today. What's equally concerning is that the amount of capital deployed in the business has shrunk by 26% over that same period. The fact that both are shrinking is an indication that the business is going through some tough times. If these underlying trends continue, we wouldn't be too optimistic going forward.
While on the subject, we noticed that the ratio of current liabilities to total assets has risen to 56%, which has impacted the ROCE. Without this increase, it's likely that ROCE would be even lower than 10%. What this means is that in reality, a rather large portion of the business is being funded by the likes of the company's suppliers or short-term creditors, which can bring some risks of its own.
In Conclusion...
In summary, it's unfortunate that Teck Guan Perdana Berhad is shrinking its capital base and also generating lower returns. It should come as no surprise then that the stock has fallen 40% over the last five years, so it looks like investors are recognizing these changes. Unless there is a shift to a more positive trajectory in these metrics, we would look elsewhere.
If you'd like to know more about Teck Guan Perdana Berhad, we've spotted 4 warning signs, and 3 of them are significant.
If you want to search for solid companies with great earnings, check out this free list of companies with good balance sheets and impressive returns on equity.
Valuation is complex, but we're here to simplify it.
Discover if Teck Guan Perdana Berhad might be undervalued or overvalued with our detailed analysis, featuring fair value estimates, potential risks, dividends, insider trades, and its financial condition.
Access Free AnalysisHave feedback on this article? Concerned about the content? Get in touch with us directly. Alternatively, email editorial-team (at) simplywallst.com.
This article by Simply Wall St is general in nature. We provide commentary based on historical data and analyst forecasts only using an unbiased methodology and our articles are not intended to be financial advice. It does not constitute a recommendation to buy or sell any stock, and does not take account of your objectives, or your financial situation. We aim to bring you long-term focused analysis driven by fundamental data. Note that our analysis may not factor in the latest price-sensitive company announcements or qualitative material. Simply Wall St has no position in any stocks mentioned.
About KLSE:TECGUAN
Teck Guan Perdana Berhad
An investment holding company, manufactures, processes, and sells cocoa butter and powder, and other cocoa products.
Excellent balance sheet with proven track record.
Market Insights

Advertisement
Community Narratives
Groundbreaking therapies that could change the treatment landscape for PTSD, fibromyalgia, MS & Alzheimer’s
Fair Value US$6.20|86.9% undervalued
CM
Community Contributor
DigitalOcean Will Grow 14% by Embracing AI with Paperspace Acquisition
Fair Value US$50.00|42.8% undervalued
NE
Community Contributor
Viant Technology: A Rising AdTech Challenger in the AI-Powered CTV Market
Fair Value US$38.61|66.0% undervalued
BL
Community Contributor
Volvo will Accelerate Forward into Electric and Autonomous Leadership in Five Years
Fair Value SEK 438.80|40.8% undervalued
UN
Community Contributor