Capital Allocation Trends At Malpac Holdings Berhad (KLSE:MALPAC) Aren't Ideal


What underlying fundamental trends can indicate that a company might be in decline? Typically, we'll see the trend of both return on capital employed (ROCE) declining and this usually coincides with a decreasing amount of capital employed. Basically the company is earning less on its investments and it is also reducing its total assets. In light of that, from a first glance at Malpac Holdings Berhad (KLSE:MALPAC), we've spotted some signs that it could be struggling, so let's investigate.
Understanding Return On Capital Employed (ROCE)
For those who don't know, ROCE is a measure of a company's yearly pre-tax profit (its return), relative to the capital employed in the business. Analysts use this formula to calculate it for Malpac Holdings Berhad:
Return on Capital Employed = Earnings Before Interest and Tax (EBIT) ÷ (Total Assets - Current Liabilities)
0.0093 = RM1.6m ÷ (RM183m - RM9.4m) (Based on the trailing twelve months to December 2023).
So, Malpac Holdings Berhad has an ROCE of 0.9%. In absolute terms, that's a low return and it also under-performs the Food industry average of 6.8%.
See our latest analysis for Malpac Holdings Berhad
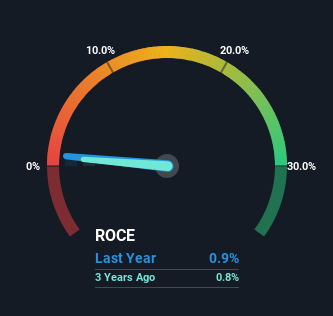
Historical performance is a great place to start when researching a stock so above you can see the gauge for Malpac Holdings Berhad's ROCE against it's prior returns. If you'd like to look at how Malpac Holdings Berhad has performed in the past in other metrics, you can view this free graph of Malpac Holdings Berhad's past earnings, revenue and cash flow.
So How Is Malpac Holdings Berhad's ROCE Trending?
In terms of Malpac Holdings Berhad's historical ROCE movements, the trend doesn't inspire confidence. To be more specific, the ROCE was 1.7% five years ago, but since then it has dropped noticeably. On top of that, it's worth noting that the amount of capital employed within the business has remained relatively steady. Companies that exhibit these attributes tend to not be shrinking, but they can be mature and facing pressure on their margins from competition. So because these trends aren't typically conducive to creating a multi-bagger, we wouldn't hold our breath on Malpac Holdings Berhad becoming one if things continue as they have.
On a side note, Malpac Holdings Berhad has done well to pay down its current liabilities to 5.1% of total assets. So we could link some of this to the decrease in ROCE. Effectively this means their suppliers or short-term creditors are funding less of the business, which reduces some elements of risk. Since the business is basically funding more of its operations with it's own money, you could argue this has made the business less efficient at generating ROCE.
In Conclusion...
In the end, the trend of lower returns on the same amount of capital isn't typically an indication that we're looking at a growth stock. Investors must expect better things on the horizon though because the stock has risen 5.2% in the last five years. Either way, we aren't huge fans of the current trends and so with that we think you might find better investments elsewhere.
Since virtually every company faces some risks, it's worth knowing what they are, and we've spotted 3 warning signs for Malpac Holdings Berhad (of which 2 don't sit too well with us!) that you should know about.
For those who like to invest in solid companies, check out this free list of companies with solid balance sheets and high returns on equity.
If you're looking to trade Malpac Holdings Berhad, open an account with the lowest-cost platform trusted by professionals, Interactive Brokers.
With clients in over 200 countries and territories, and access to 160 markets, IBKR lets you trade stocks, options, futures, forex, bonds and funds from a single integrated account.
Enjoy no hidden fees, no account minimums, and FX conversion rates as low as 0.03%, far better than what most brokers offer.
Sponsored ContentNew: Manage All Your Stock Portfolios in One Place
We've created the ultimate portfolio companion for stock investors, and it's free.
• Connect an unlimited number of Portfolios and see your total in one currency
• Be alerted to new Warning Signs or Risks via email or mobile
• Track the Fair Value of your stocks
Have feedback on this article? Concerned about the content? Get in touch with us directly. Alternatively, email editorial-team (at) simplywallst.com.
This article by Simply Wall St is general in nature. We provide commentary based on historical data and analyst forecasts only using an unbiased methodology and our articles are not intended to be financial advice. It does not constitute a recommendation to buy or sell any stock, and does not take account of your objectives, or your financial situation. We aim to bring you long-term focused analysis driven by fundamental data. Note that our analysis may not factor in the latest price-sensitive company announcements or qualitative material. Simply Wall St has no position in any stocks mentioned.
About KLSE:MALPAC
Malpac Holdings Berhad
An investment holding company, engages in managing a diversified portfolio of investments in Malaysia.
Flawless balance sheet moderate.
Market Insights

Community Narratives

