
Advertisement
Estimating The Intrinsic Value Of Lay Hong Berhad (KLSE:LAYHONG)

Today we'll do a simple run through of a valuation method used to estimate the attractiveness of Lay Hong Berhad (KLSE:LAYHONG) as an investment opportunity by estimating the company's future cash flows and discounting them to their present value. Our analysis will employ the Discounted Cash Flow (DCF) model. There's really not all that much to it, even though it might appear quite complex.
We would caution that there are many ways of valuing a company and, like the DCF, each technique has advantages and disadvantages in certain scenarios. Anyone interested in learning a bit more about intrinsic value should have a read of the Simply Wall St analysis model.
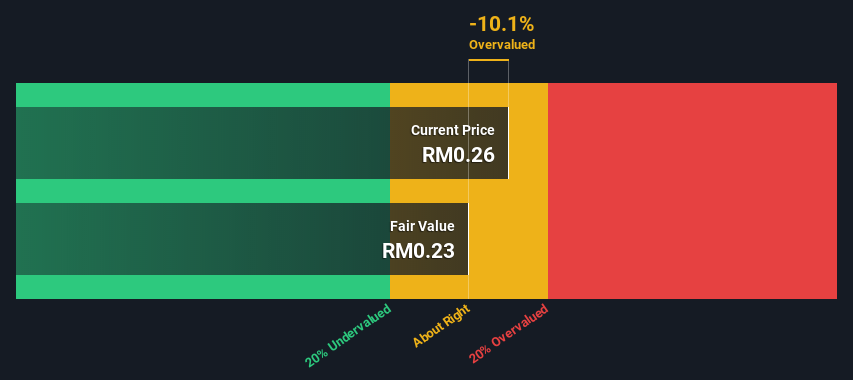
Our analysis indicates that LAYHONG is potentially overvalued!
The Model
We are going to use a two-stage DCF model, which, as the name states, takes into account two stages of growth. The first stage is generally a higher growth period which levels off heading towards the terminal value, captured in the second 'steady growth' period. To start off with, we need to estimate the next ten years of cash flows. Seeing as no analyst estimates of free cash flow are available to us, we have extrapolate the previous free cash flow (FCF) from the company's last reported value. We assume companies with shrinking free cash flow will slow their rate of shrinkage, and that companies with growing free cash flow will see their growth rate slow, over this period. We do this to reflect that growth tends to slow more in the early years than it does in later years.
Generally we assume that a dollar today is more valuable than a dollar in the future, so we discount the value of these future cash flows to their estimated value in today's dollars:
10-year free cash flow (FCF) forecast
| 2023 | 2024 | 2025 | 2026 | 2027 | 2028 | 2029 | 2030 | 2031 | 2032 | |
| Levered FCF (MYR, Millions) | RM21.5m | RM17.4m | RM15.2m | RM14.1m | RM13.5m | RM13.2m | RM13.2m | RM13.3m | RM13.5m | RM13.8m |
| Growth Rate Estimate Source | Est @ -28.9% | Est @ -19.17% | Est @ -12.35% | Est @ -7.58% | Est @ -4.24% | Est @ -1.9% | Est @ -0.27% | Est @ 0.88% | Est @ 1.68% | Est @ 2.24% |
| Present Value (MYR, Millions) Discounted @ 10% | RM19.5 | RM14.3 | RM11.3 | RM9.5 | RM8.2 | RM7.3 | RM6.6 | RM6.0 | RM5.6 | RM5.2 |
("Est" = FCF growth rate estimated by Simply Wall St)
Present Value of 10-year Cash Flow (PVCF) = RM93m
We now need to calculate the Terminal Value, which accounts for all the future cash flows after this ten year period. The Gordon Growth formula is used to calculate Terminal Value at a future annual growth rate equal to the 5-year average of the 10-year government bond yield of 3.6%. We discount the terminal cash flows to today's value at a cost of equity of 10%.
Terminal Value (TV)= FCF2032 × (1 + g) ÷ (r – g) = RM14m× (1 + 3.6%) ÷ (10%– 3.6%) = RM210m
Present Value of Terminal Value (PVTV)= TV / (1 + r)10= RM210m÷ ( 1 + 10%)10= RM78m
The total value is the sum of cash flows for the next ten years plus the discounted terminal value, which results in the Total Equity Value, which in this case is RM171m. To get the intrinsic value per share, we divide this by the total number of shares outstanding. Relative to the current share price of RM0.3, the company appears around fair value at the time of writing. The assumptions in any calculation have a big impact on the valuation, so it is better to view this as a rough estimate, not precise down to the last cent.
Important Assumptions
We would point out that the most important inputs to a discounted cash flow are the discount rate and of course the actual cash flows. If you don't agree with these result, have a go at the calculation yourself and play with the assumptions. The DCF also does not consider the possible cyclicality of an industry, or a company's future capital requirements, so it does not give a full picture of a company's potential performance. Given that we are looking at Lay Hong Berhad as potential shareholders, the cost of equity is used as the discount rate, rather than the cost of capital (or weighted average cost of capital, WACC) which accounts for debt. In this calculation we've used 10%, which is based on a levered beta of 1.038. Beta is a measure of a stock's volatility, compared to the market as a whole. We get our beta from the industry average beta of globally comparable companies, with an imposed limit between 0.8 and 2.0, which is a reasonable range for a stable business.
Looking Ahead:
Although the valuation of a company is important, it is only one of many factors that you need to assess for a company. It's not possible to obtain a foolproof valuation with a DCF model. Instead the best use for a DCF model is to test certain assumptions and theories to see if they would lead to the company being undervalued or overvalued. For instance, if the terminal value growth rate is adjusted slightly, it can dramatically alter the overall result. For Lay Hong Berhad, we've compiled three additional items you should look at:
- Risks: For example, we've discovered 4 warning signs for Lay Hong Berhad (1 can't be ignored!) that you should be aware of before investing here.
- Other High Quality Alternatives: Do you like a good all-rounder? Explore our interactive list of high quality stocks to get an idea of what else is out there you may be missing!
- Other Top Analyst Picks: Interested to see what the analysts are thinking? Take a look at our interactive list of analysts' top stock picks to find out what they feel might have an attractive future outlook!
PS. Simply Wall St updates its DCF calculation for every Malaysian stock every day, so if you want to find the intrinsic value of any other stock just search here.
New: AI Stock Screener & Alerts
Our new AI Stock Screener scans the market every day to uncover opportunities.
• Dividend Powerhouses (3%+ Yield)
• Undervalued Small Caps with Insider Buying
• High growth Tech and AI Companies
Or build your own from over 50 metrics.
Have feedback on this article? Concerned about the content? Get in touch with us directly. Alternatively, email editorial-team (at) simplywallst.com.
This article by Simply Wall St is general in nature. We provide commentary based on historical data and analyst forecasts only using an unbiased methodology and our articles are not intended to be financial advice. It does not constitute a recommendation to buy or sell any stock, and does not take account of your objectives, or your financial situation. We aim to bring you long-term focused analysis driven by fundamental data. Note that our analysis may not factor in the latest price-sensitive company announcements or qualitative material. Simply Wall St has no position in any stocks mentioned.
About KLSE:LAYHONG
Lay Hong Berhad
An investment holding company, engages in the integrated livestock farming in Malaysia.
Flawless balance sheet and good value.
Market Insights


Advertisement
Community Narratives
A Quality Compounder Marked Down on Overblown Fears
Fair Value US$120.72|62.4% undervalued
BA
Community Contributor

Wyndham Continues Global Expansion with 19% Ancillary Revenue Growth
Fair Value US$105.80|19.2% undervalued
ZW
Community Contributor