
Today we'll do a simple run through of a valuation method used to estimate the attractiveness of KNM Group Berhad (KLSE:KNM) as an investment opportunity by taking the expected future cash flows and discounting them to their present value. Our analysis will employ the Discounted Cash Flow (DCF) model. Models like these may appear beyond the comprehension of a lay person, but they're fairly easy to follow.
We generally believe that a company's value is the present value of all of the cash it will generate in the future. However, a DCF is just one valuation metric among many, and it is not without flaws. If you still have some burning questions about this type of valuation, take a look at the Simply Wall St analysis model.
View our latest analysis for KNM Group Berhad
Is KNM Group Berhad Fairly Valued?
We are going to use a two-stage DCF model, which, as the name states, takes into account two stages of growth. The first stage is generally a higher growth period which levels off heading towards the terminal value, captured in the second 'steady growth' period. In the first stage we need to estimate the cash flows to the business over the next ten years. Seeing as no analyst estimates of free cash flow are available to us, we have extrapolate the previous free cash flow (FCF) from the company's last reported value. We assume companies with shrinking free cash flow will slow their rate of shrinkage, and that companies with growing free cash flow will see their growth rate slow, over this period. We do this to reflect that growth tends to slow more in the early years than it does in later years.
Generally we assume that a dollar today is more valuable than a dollar in the future, so we need to discount the sum of these future cash flows to arrive at a present value estimate:
10-year free cash flow (FCF) estimate
| 2023 | 2024 | 2025 | 2026 | 2027 | 2028 | 2029 | 2030 | 2031 | 2032 | |
| Levered FCF (MYR, Millions) | RM41.0m | RM33.6m | RM29.8m | RM27.7m | RM26.6m | RM26.2m | RM26.2m | RM26.4m | RM26.9m | RM27.5m |
| Growth Rate Estimate Source | Est @ -27.18% | Est @ -17.96% | Est @ -11.51% | Est @ -6.99% | Est @ -3.83% | Est @ -1.61% | Est @ -0.07% | Est @ 1.02% | Est @ 1.78% | Est @ 2.31% |
| Present Value (MYR, Millions) Discounted @ 17% | RM35.1 | RM24.7 | RM18.7 | RM14.9 | RM12.3 | RM10.4 | RM8.9 | RM7.7 | RM6.7 | RM5.9 |
("Est" = FCF growth rate estimated by Simply Wall St)
Present Value of 10-year Cash Flow (PVCF) = RM145m
After calculating the present value of future cash flows in the initial 10-year period, we need to calculate the Terminal Value, which accounts for all future cash flows beyond the first stage. For a number of reasons a very conservative growth rate is used that cannot exceed that of a country's GDP growth. In this case we have used the 5-year average of the 10-year government bond yield (3.6%) to estimate future growth. In the same way as with the 10-year 'growth' period, we discount future cash flows to today's value, using a cost of equity of 17%.
Terminal Value (TV)= FCF2032 × (1 + g) ÷ (r – g) = RM28m× (1 + 3.6%) ÷ (17%– 3.6%) = RM217m
Present Value of Terminal Value (PVTV)= TV / (1 + r)10= RM217m÷ ( 1 + 17%)10= RM47m
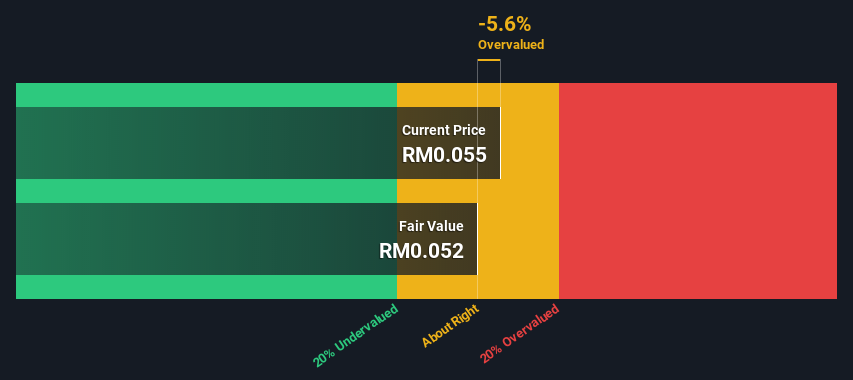
The total value is the sum of cash flows for the next ten years plus the discounted terminal value, which results in the Total Equity Value, which in this case is RM192m. The last step is to then divide the equity value by the number of shares outstanding. Compared to the current share price of RM0.06, the company appears around fair value at the time of writing. The assumptions in any calculation have a big impact on the valuation, so it is better to view this as a rough estimate, not precise down to the last cent.
The Assumptions
We would point out that the most important inputs to a discounted cash flow are the discount rate and of course the actual cash flows. Part of investing is coming up with your own evaluation of a company's future performance, so try the calculation yourself and check your own assumptions. The DCF also does not consider the possible cyclicality of an industry, or a company's future capital requirements, so it does not give a full picture of a company's potential performance. Given that we are looking at KNM Group Berhad as potential shareholders, the cost of equity is used as the discount rate, rather than the cost of capital (or weighted average cost of capital, WACC) which accounts for debt. In this calculation we've used 17%, which is based on a levered beta of 2.000. Beta is a measure of a stock's volatility, compared to the market as a whole. We get our beta from the industry average beta of globally comparable companies, with an imposed limit between 0.8 and 2.0, which is a reasonable range for a stable business.
SWOT Analysis for KNM Group Berhad
- No major strengths identified for KNM.
- Current share price is above our estimate of fair value.
- Shareholders have been diluted in the past year.
- Has sufficient cash runway for more than 3 years based on current free cash flows.
- Lack of analyst coverage makes it difficult to determine KNM's earnings prospects.
- Debt is not well covered by operating cash flow.
Looking Ahead:
Valuation is only one side of the coin in terms of building your investment thesis, and it shouldn't be the only metric you look at when researching a company. The DCF model is not a perfect stock valuation tool. Rather it should be seen as a guide to "what assumptions need to be true for this stock to be under/overvalued?" For example, changes in the company's cost of equity or the risk free rate can significantly impact the valuation. For KNM Group Berhad, we've compiled three important items you should explore:
- Risks: Case in point, we've spotted 3 warning signs for KNM Group Berhad you should be aware of, and 1 of them makes us a bit uncomfortable.
- Other Solid Businesses: Low debt, high returns on equity and good past performance are fundamental to a strong business. Why not explore our interactive list of stocks with solid business fundamentals to see if there are other companies you may not have considered!
- Other Top Analyst Picks: Interested to see what the analysts are thinking? Take a look at our interactive list of analysts' top stock picks to find out what they feel might have an attractive future outlook!
PS. Simply Wall St updates its DCF calculation for every Malaysian stock every day, so if you want to find the intrinsic value of any other stock just search here.
The New Payments ETF Is Live on NASDAQ:
Money is moving to real-time rails, and a newly listed ETF now gives investors direct exposure. Fast settlement. Institutional custody. Simple access.
Explore how this launch could reshape portfolios
Sponsored ContentValuation is complex, but we're here to simplify it.
Discover if KNM Group Berhad might be undervalued or overvalued with our detailed analysis, featuring fair value estimates, potential risks, dividends, insider trades, and its financial condition.
Access Free AnalysisHave feedback on this article? Concerned about the content? Get in touch with us directly. Alternatively, email editorial-team (at) simplywallst.com.
This article by Simply Wall St is general in nature. We provide commentary based on historical data and analyst forecasts only using an unbiased methodology and our articles are not intended to be financial advice. It does not constitute a recommendation to buy or sell any stock, and does not take account of your objectives, or your financial situation. We aim to bring you long-term focused analysis driven by fundamental data. Note that our analysis may not factor in the latest price-sensitive company announcements or qualitative material. Simply Wall St has no position in any stocks mentioned.
About KLSE:KNM
KNM Group Berhad
Provides project management, engineering, manufacturing, and maintenance services worldwide.
Slight risk with mediocre balance sheet.
Market Insights

Weekly Picks

Early mover in a fast growing industry. Likely to experience share price volatility as they scale


A case for CA$31.80 (undiluted), aka 8,616% upside from CA$0.37 (an 86 bagger!).


Moderation and Stabilisation: HOLD: Fair Price based on a 4-year Cycle is $12.08
Recently Updated Narratives


An amazing opportunity to potentially get a 100 bagger

Amazon: Why the World’s Biggest Platform Still Runs on Invisible Economics

Sunrun Stock: When the Energy Transition Collides With the Cost of Capital
Popular Narratives


MicroVision will explode future revenue by 380.37% with a vision towards success


Crazy Undervalued 42 Baggers Silver Play (Active & Running Mine)

