
Advertisement
- Malaysia
- /
- Energy Services
- /
- KLSE:LFG
Icon Offshore Berhad (KLSE:ICON) Has A Somewhat Strained Balance Sheet

Some say volatility, rather than debt, is the best way to think about risk as an investor, but Warren Buffett famously said that 'Volatility is far from synonymous with risk.' It's only natural to consider a company's balance sheet when you examine how risky it is, since debt is often involved when a business collapses. Importantly, Icon Offshore Berhad (KLSE:ICON) does carry debt. But should shareholders be worried about its use of debt?
When Is Debt Dangerous?
Debt and other liabilities become risky for a business when it cannot easily fulfill those obligations, either with free cash flow or by raising capital at an attractive price. Part and parcel of capitalism is the process of 'creative destruction' where failed businesses are mercilessly liquidated by their bankers. However, a more frequent (but still costly) occurrence is where a company must issue shares at bargain-basement prices, permanently diluting shareholders, just to shore up its balance sheet. Having said that, the most common situation is where a company manages its debt reasonably well - and to its own advantage. When we examine debt levels, we first consider both cash and debt levels, together.
View our latest analysis for Icon Offshore Berhad
What Is Icon Offshore Berhad's Net Debt?
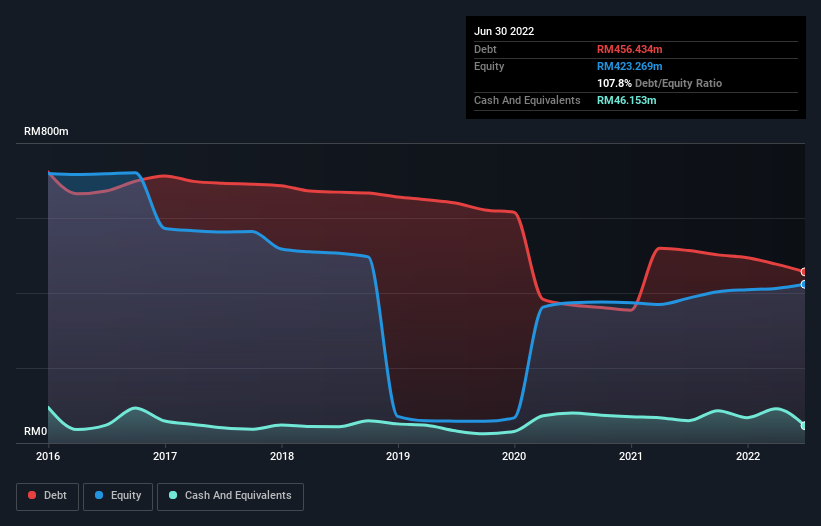
You can click the graphic below for the historical numbers, but it shows that Icon Offshore Berhad had RM456.4m of debt in June 2022, down from RM513.1m, one year before. However, it also had RM46.2m in cash, and so its net debt is RM410.3m.
How Healthy Is Icon Offshore Berhad's Balance Sheet?
Zooming in on the latest balance sheet data, we can see that Icon Offshore Berhad had liabilities of RM233.7m due within 12 months and liabilities of RM286.0m due beyond that. Offsetting these obligations, it had cash of RM46.2m as well as receivables valued at RM131.4m due within 12 months. So its liabilities total RM342.1m more than the combination of its cash and short-term receivables.
When you consider that this deficiency exceeds the company's RM297.5m market capitalization, you might well be inclined to review the balance sheet intently. Hypothetically, extremely heavy dilution would be required if the company were forced to pay down its liabilities by raising capital at the current share price.
We measure a company's debt load relative to its earnings power by looking at its net debt divided by its earnings before interest, tax, depreciation, and amortization (EBITDA) and by calculating how easily its earnings before interest and tax (EBIT) cover its interest expense (interest cover). This way, we consider both the absolute quantum of the debt, as well as the interest rates paid on it.
While we wouldn't worry about Icon Offshore Berhad's net debt to EBITDA ratio of 2.9, we think its super-low interest cover of 2.2 times is a sign of high leverage. It seems clear that the cost of borrowing money is negatively impacting returns for shareholders, of late. Looking on the bright side, Icon Offshore Berhad boosted its EBIT by a silky 58% in the last year. Like a mother's loving embrace of a newborn that sort of growth builds resilience, putting the company in a stronger position to manage its debt. When analysing debt levels, the balance sheet is the obvious place to start. But it is future earnings, more than anything, that will determine Icon Offshore Berhad's ability to maintain a healthy balance sheet going forward. So if you want to see what the professionals think, you might find this free report on analyst profit forecasts to be interesting.
Finally, while the tax-man may adore accounting profits, lenders only accept cold hard cash. So the logical step is to look at the proportion of that EBIT that is matched by actual free cash flow. Over the last three years, Icon Offshore Berhad recorded negative free cash flow, in total. Debt is usually more expensive, and almost always more risky in the hands of a company with negative free cash flow. Shareholders ought to hope for an improvement.
Our View
To be frank both Icon Offshore Berhad's interest cover and its track record of converting EBIT to free cash flow make us rather uncomfortable with its debt levels. But at least it's pretty decent at growing its EBIT; that's encouraging. Looking at the bigger picture, it seems clear to us that Icon Offshore Berhad's use of debt is creating risks for the company. If all goes well, that should boost returns, but on the flip side, the risk of permanent capital loss is elevated by the debt. There's no doubt that we learn most about debt from the balance sheet. However, not all investment risk resides within the balance sheet - far from it. We've identified 3 warning signs with Icon Offshore Berhad (at least 1 which doesn't sit too well with us) , and understanding them should be part of your investment process.
At the end of the day, it's often better to focus on companies that are free from net debt. You can access our special list of such companies (all with a track record of profit growth). It's free.
New: AI Stock Screener & Alerts
Our new AI Stock Screener scans the market every day to uncover opportunities.
• Dividend Powerhouses (3%+ Yield)
• Undervalued Small Caps with Insider Buying
• High growth Tech and AI Companies
Or build your own from over 50 metrics.
Have feedback on this article? Concerned about the content? Get in touch with us directly. Alternatively, email editorial-team (at) simplywallst.com.
This article by Simply Wall St is general in nature. We provide commentary based on historical data and analyst forecasts only using an unbiased methodology and our articles are not intended to be financial advice. It does not constitute a recommendation to buy or sell any stock, and does not take account of your objectives, or your financial situation. We aim to bring you long-term focused analysis driven by fundamental data. Note that our analysis may not factor in the latest price-sensitive company announcements or qualitative material. Simply Wall St has no position in any stocks mentioned.
About KLSE:LFG
Lianson Fleet Group Berhad
An investment holding company, provides vessel chartering, ship management, and offshore marine services to the oil and gas related industries in Malaysia and Brunei.
Flawless balance sheet with acceptable track record.
Market Insights


Advertisement
Community Narratives
Alphabet: The Under-appreciated Compounder Hiding in Plain Sight
Fair Value US$282.83|31.8% undervalued
BL
Community Contributor
Planet Labs: At The Heart Of The Emerging New Space Boom
Fair Value US$11.31|44.7% undervalued
AN
Community Contributor
Exxon in Guyana 5 year forecast Low $135 to High $189
Fair Value US$174.00|35.8% undervalued
AG
Community Contributor