- Malaysia
- /
- Energy Services
- /
- KLSE:HANDAL
Handal Energy Berhad (KLSE:HANDAL) Is Carrying A Fair Bit Of Debt


Warren Buffett famously said, 'Volatility is far from synonymous with risk.' When we think about how risky a company is, we always like to look at its use of debt, since debt overload can lead to ruin. We can see that Handal Energy Berhad (KLSE:HANDAL) does use debt in its business. But the real question is whether this debt is making the company risky.
What Risk Does Debt Bring?
Debt assists a business until the business has trouble paying it off, either with new capital or with free cash flow. If things get really bad, the lenders can take control of the business. However, a more usual (but still expensive) situation is where a company must dilute shareholders at a cheap share price simply to get debt under control. Of course, debt can be an important tool in businesses, particularly capital heavy businesses. When we examine debt levels, we first consider both cash and debt levels, together.
See our latest analysis for Handal Energy Berhad
What Is Handal Energy Berhad's Debt?
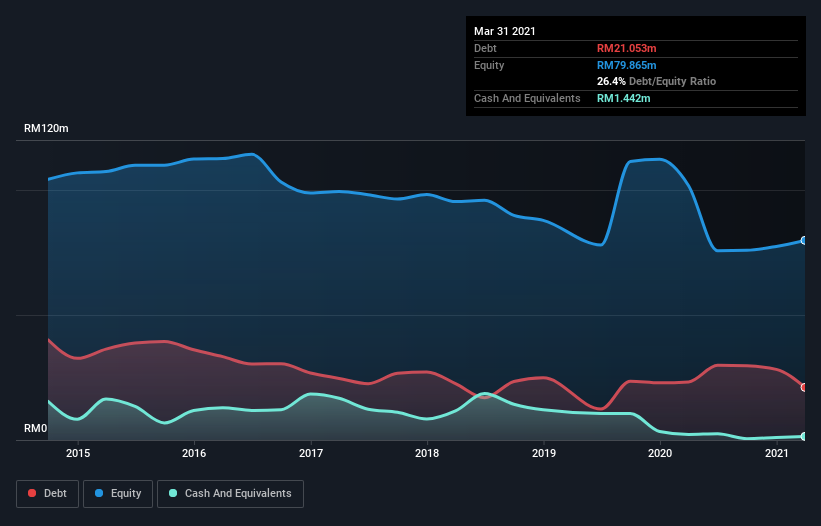
The image below, which you can click on for greater detail, shows that Handal Energy Berhad had debt of RM21.1m at the end of March 2021, a reduction from RM23.2m over a year. However, it also had RM1.44m in cash, and so its net debt is RM19.6m.
A Look At Handal Energy Berhad's Liabilities
Zooming in on the latest balance sheet data, we can see that Handal Energy Berhad had liabilities of RM45.1m due within 12 months and liabilities of RM3.81m due beyond that. On the other hand, it had cash of RM1.44m and RM38.1m worth of receivables due within a year. So it has liabilities totalling RM9.39m more than its cash and near-term receivables, combined.
Of course, Handal Energy Berhad has a market capitalization of RM50.8m, so these liabilities are probably manageable. Having said that, it's clear that we should continue to monitor its balance sheet, lest it change for the worse. When analysing debt levels, the balance sheet is the obvious place to start. But you can't view debt in total isolation; since Handal Energy Berhad will need earnings to service that debt. So if you're keen to discover more about its earnings, it might be worth checking out this graph of its long term earnings trend.
Over 12 months, Handal Energy Berhad made a loss at the EBIT level, and saw its revenue drop to RM76m, which is a fall of 14%. That's not what we would hope to see.
Caveat Emptor
While Handal Energy Berhad's falling revenue is about as heartwarming as a wet blanket, arguably its earnings before interest and tax (EBIT) loss is even less appealing. Indeed, it lost a very considerable RM9.4m at the EBIT level. Considering that alongside the liabilities mentioned above does not give us much confidence that company should be using so much debt. Quite frankly we think the balance sheet is far from match-fit, although it could be improved with time. We would feel better if it turned its trailing twelve month loss of RM17m into a profit. In the meantime, we consider the stock very risky. There's no doubt that we learn most about debt from the balance sheet. But ultimately, every company can contain risks that exist outside of the balance sheet. Be aware that Handal Energy Berhad is showing 3 warning signs in our investment analysis , and 1 of those doesn't sit too well with us...
If you're interested in investing in businesses that can grow profits without the burden of debt, then check out this free list of growing businesses that have net cash on the balance sheet.
If you're looking for stocks to buy, use the lowest-cost* platform that is rated #1 Overall by Barron’s, Interactive Brokers. Trade stocks, options, futures, forex, bonds and funds on 135 markets, all from a single integrated account. Promoted
If you're looking to trade Handal Energy Berhad, open an account with the lowest-cost platform trusted by professionals, Interactive Brokers.
With clients in over 200 countries and territories, and access to 160 markets, IBKR lets you trade stocks, options, futures, forex, bonds and funds from a single integrated account.
Enjoy no hidden fees, no account minimums, and FX conversion rates as low as 0.03%, far better than what most brokers offer.
Sponsored ContentValuation is complex, but we're here to simplify it.
Discover if Handal Energy Berhad might be undervalued or overvalued with our detailed analysis, featuring fair value estimates, potential risks, dividends, insider trades, and its financial condition.
Access Free AnalysisThis article by Simply Wall St is general in nature. We provide commentary based on historical data and analyst forecasts only using an unbiased methodology and our articles are not intended to be financial advice. It does not constitute a recommendation to buy or sell any stock, and does not take account of your objectives, or your financial situation. We aim to bring you long-term focused analysis driven by fundamental data. Note that our analysis may not factor in the latest price-sensitive company announcements or qualitative material. Simply Wall St has no position in any stocks mentioned.
*Interactive Brokers Rated Lowest Cost Broker by StockBrokers.com Annual Online Review 2020
Have feedback on this article? Concerned about the content? Get in touch with us directly. Alternatively, email editorial-team (at) simplywallst.com.
About KLSE:HANDAL
Handal Energy Berhad
An investment holding company, primarily provides integrated crane and pipeline isolation services to the oil and gas industry in Malaysia.
Low and overvalued.
Market Insights

Community Narratives

