
Advertisement
- Malaysia
- /
- Hospitality
- /
- KLSE:TECHNAX
Not Many Are Piling Into Techna-X Berhad (KLSE:TECHNAX) Stock Yet As It Plummets 33%

Techna-X Berhad (KLSE:TECHNAX) shareholders won't be pleased to see that the share price has had a very rough month, dropping 33% and undoing the prior period's positive performance. Instead of being rewarded, shareholders who have already held through the last twelve months are now sitting on a 33% share price drop.
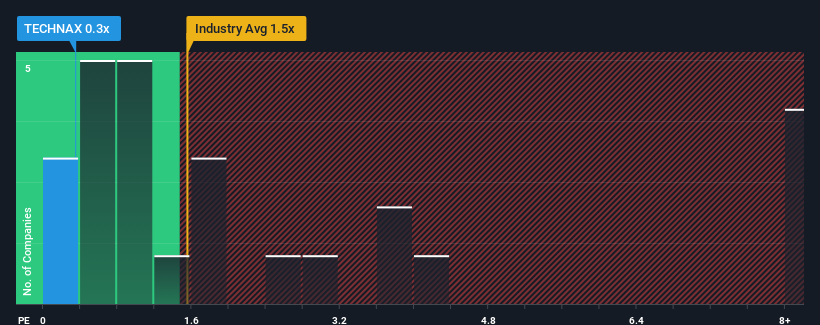
Following the heavy fall in price, Techna-X Berhad's price-to-sales (or "P/S") ratio of 0.3x might make it look like a buy right now compared to the Hospitality industry in Malaysia, where around half of the companies have P/S ratios above 1.5x and even P/S above 4x are quite common. Although, it's not wise to just take the P/S at face value as there may be an explanation why it's limited.
Check out our latest analysis for Techna-X Berhad
How Has Techna-X Berhad Performed Recently?
For example, consider that Techna-X Berhad's financial performance has been poor lately as its revenue has been in decline. One possibility is that the P/S is low because investors think the company won't do enough to avoid underperforming the broader industry in the near future. Those who are bullish on Techna-X Berhad will be hoping that this isn't the case so that they can pick up the stock at a lower valuation.
Want the full picture on earnings, revenue and cash flow for the company? Then our free report on Techna-X Berhad will help you shine a light on its historical performance.How Is Techna-X Berhad's Revenue Growth Trending?
Techna-X Berhad's P/S ratio would be typical for a company that's only expected to deliver limited growth, and importantly, perform worse than the industry.
Taking a look back first, the company's revenue growth last year wasn't something to get excited about as it posted a disappointing decline of 14%. However, a few very strong years before that means that it was still able to grow revenue by an impressive 225% in total over the last three years. So we can start by confirming that the company has generally done a very good job of growing revenue over that time, even though it had some hiccups along the way.
Comparing that to the industry, which is only predicted to deliver 4.5% growth in the next 12 months, the company's momentum is stronger based on recent medium-term annualised revenue results.
With this in mind, we find it intriguing that Techna-X Berhad's P/S isn't as high compared to that of its industry peers. Apparently some shareholders believe the recent performance has exceeded its limits and have been accepting significantly lower selling prices.
What Does Techna-X Berhad's P/S Mean For Investors?
Techna-X Berhad's recently weak share price has pulled its P/S back below other Hospitality companies. Using the price-to-sales ratio alone to determine if you should sell your stock isn't sensible, however it can be a practical guide to the company's future prospects.
We're very surprised to see Techna-X Berhad currently trading on a much lower than expected P/S since its recent three-year growth is higher than the wider industry forecast. When we see robust revenue growth that outpaces the industry, we presume that there are notable underlying risks to the company's future performance, which is exerting downward pressure on the P/S ratio. At least price risks look to be very low if recent medium-term revenue trends continue, but investors seem to think future revenue could see a lot of volatility.
It is also worth noting that we have found 2 warning signs for Techna-X Berhad that you need to take into consideration.
If you're unsure about the strength of Techna-X Berhad's business, why not explore our interactive list of stocks with solid business fundamentals for some other companies you may have missed.
Valuation is complex, but we're here to simplify it.
Discover if Techna-X Berhad might be undervalued or overvalued with our detailed analysis, featuring fair value estimates, potential risks, dividends, insider trades, and its financial condition.
Access Free AnalysisHave feedback on this article? Concerned about the content? Get in touch with us directly. Alternatively, email editorial-team (at) simplywallst.com.
This article by Simply Wall St is general in nature. We provide commentary based on historical data and analyst forecasts only using an unbiased methodology and our articles are not intended to be financial advice. It does not constitute a recommendation to buy or sell any stock, and does not take account of your objectives, or your financial situation. We aim to bring you long-term focused analysis driven by fundamental data. Note that our analysis may not factor in the latest price-sensitive company announcements or qualitative material. Simply Wall St has no position in any stocks mentioned.
About KLSE:TECHNAX
Techna-X Berhad
An investment holding company, primarily engages in the restaurant operation and franchising business in the People’s Republic of China and Malaysia.
Slight and fair value.
Market Insights


Advertisement
Community Narratives
For the Emperor: Why Games Workshop Could Be a Star Investment
Fair Value UK£160.00|0.4% overvalued
RO
Community Contributor
Securitas will boost margins with AI and tech-driven services
Fair Value SEK 260.91|44.5% undervalued
UN
Community Contributor
A Leader in EV Charging with Growth Potential
Fair Value €27.00|17.8% undervalued
TI
Community Contributor