
Advertisement
- Malaysia
- /
- Consumer Durables
- /
- KLSE:TCS
The Market Lifts TCS Group Holdings Berhad (KLSE:TCS) Shares 30% But It Can Do More
TCS Group Holdings Berhad (KLSE:TCS) shareholders would be excited to see that the share price has had a great month, posting a 30% gain and recovering from prior weakness. While recent buyers may be laughing, long-term holders might not be as pleased since the recent gain only brings the stock back to where it started a year ago.
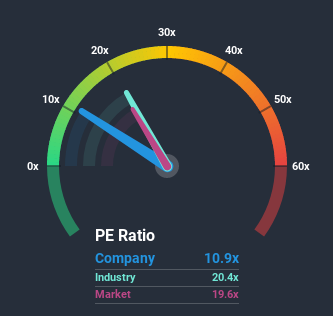
In spite of the firm bounce in price, given close to half the companies in Malaysia have price-to-earnings ratios (or "P/E's") above 20x, you may still consider TCS Group Holdings Berhad as an attractive investment with its 10.9x P/E ratio. Nonetheless, we'd need to dig a little deeper to determine if there is a rational basis for the reduced P/E.
TCS Group Holdings Berhad certainly has been doing a good job lately as its earnings growth has been positive while most other companies have been seeing their earnings go backwards. One possibility is that the P/E is low because investors think the company's earnings are going to fall away like everyone else's soon. If not, then existing shareholders have reason to be quite optimistic about the future direction of the share price.
View our latest analysis for TCS Group Holdings Berhad
What Are Growth Metrics Telling Us About The Low P/E?
There's an inherent assumption that a company should underperform the market for P/E ratios like TCS Group Holdings Berhad's to be considered reasonable.
Taking a look back first, we see that the company grew earnings per share by an impressive 62% last year. The latest three year period has also seen an excellent 208% overall rise in EPS, aided by its short-term performance. Accordingly, shareholders would have probably welcomed those medium-term rates of earnings growth.
Turning to the outlook, the next three years should generate growth of 41% each year as estimated by the three analysts watching the company. Meanwhile, the rest of the market is forecast to only expand by 18% each year, which is noticeably less attractive.
With this information, we find it odd that TCS Group Holdings Berhad is trading at a P/E lower than the market. It looks like most investors are not convinced at all that the company can achieve future growth expectations.
What We Can Learn From TCS Group Holdings Berhad's P/E?
Despite TCS Group Holdings Berhad's shares building up a head of steam, its P/E still lags most other companies. It's argued the price-to-earnings ratio is an inferior measure of value within certain industries, but it can be a powerful business sentiment indicator.
We've established that TCS Group Holdings Berhad currently trades on a much lower than expected P/E since its forecast growth is higher than the wider market. There could be some major unobserved threats to earnings preventing the P/E ratio from matching the positive outlook. At least price risks look to be very low, but investors seem to think future earnings could see a lot of volatility.
There are also other vital risk factors to consider before investing and we've discovered 4 warning signs for TCS Group Holdings Berhad that you should be aware of.
It's important to make sure you look for a great company, not just the first idea you come across. So take a peek at this free list of interesting companies with strong recent earnings growth (and a P/E ratio below 20x).
If you decide to trade TCS Group Holdings Berhad, use the lowest-cost* platform that is rated #1 Overall by Barron’s, Interactive Brokers. Trade stocks, options, futures, forex, bonds and funds on 135 markets, all from a single integrated account. Promoted
Valuation is complex, but we're here to simplify it.
Discover if TCS Group Holdings Berhad might be undervalued or overvalued with our detailed analysis, featuring fair value estimates, potential risks, dividends, insider trades, and its financial condition.
Access Free AnalysisThis article by Simply Wall St is general in nature. It does not constitute a recommendation to buy or sell any stock, and does not take account of your objectives, or your financial situation. We aim to bring you long-term focused analysis driven by fundamental data. Note that our analysis may not factor in the latest price-sensitive company announcements or qualitative material. Simply Wall St has no position in any stocks mentioned.
*Interactive Brokers Rated Lowest Cost Broker by StockBrokers.com Annual Online Review 2020
Have feedback on this article? Concerned about the content? Get in touch with us directly. Alternatively, email editorial-team@simplywallst.com.
About KLSE:TCS
TCS Group Holdings Berhad
An investment holding company, provides construction services for buildings, infrastructure, civil, and structural works in Malaysia.
Mediocre balance sheet with low risk.
Market Insights

Advertisement
Community Narratives
Finding The True Value Of A Logistics Powerhouse
Fair Value US$95.21|8.4% undervalued
NV
Community Contributor
Paradigm Biopharmaceuticals Will Lead Osteoarthritis Treatment with Zilosul's FDA Success
Fair Value AU$5.50|92.1% undervalued
AM
Community Contributor
Barrick Mining (ABX:CA): A Gold Hedge against a U.S. Shutdown
Fair Value CA$60.00|24.2% undervalued
GM
Community Contributor