
Advertisement
- Malaysia
- /
- Consumer Durables
- /
- KLSE:SYNERGY
Synergy House Berhad (KLSE:SYNERGY) Has A Pretty Healthy Balance Sheet
Legendary fund manager Li Lu (who Charlie Munger backed) once said, 'The biggest investment risk is not the volatility of prices, but whether you will suffer a permanent loss of capital.' So it might be obvious that you need to consider debt, when you think about how risky any given stock is, because too much debt can sink a company. Importantly, Synergy House Berhad (KLSE:SYNERGY) does carry debt. But is this debt a concern to shareholders?
Why Does Debt Bring Risk?
Debt assists a business until the business has trouble paying it off, either with new capital or with free cash flow. If things get really bad, the lenders can take control of the business. However, a more common (but still painful) scenario is that it has to raise new equity capital at a low price, thus permanently diluting shareholders. Of course, debt can be an important tool in businesses, particularly capital heavy businesses. When we examine debt levels, we first consider both cash and debt levels, together.
See our latest analysis for Synergy House Berhad
What Is Synergy House Berhad's Net Debt?
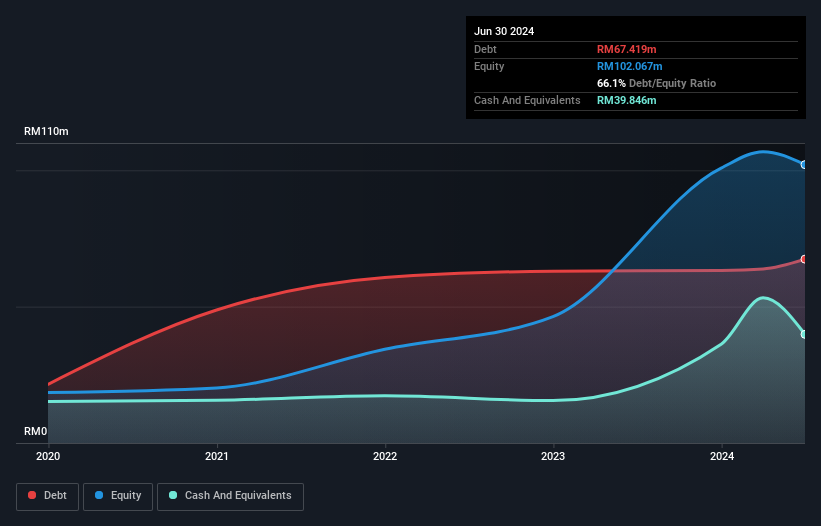
The image below, which you can click on for greater detail, shows that at June 2024 Synergy House Berhad had debt of RM67.4m, up from RM63.0m in one year. On the flip side, it has RM39.8m in cash leading to net debt of about RM27.6m.
A Look At Synergy House Berhad's Liabilities
According to the last reported balance sheet, Synergy House Berhad had liabilities of RM84.9m due within 12 months, and liabilities of RM30.3m due beyond 12 months. Offsetting this, it had RM39.8m in cash and RM54.7m in receivables that were due within 12 months. So it has liabilities totalling RM20.6m more than its cash and near-term receivables, combined.
Of course, Synergy House Berhad has a market capitalization of RM570.0m, so these liabilities are probably manageable. Having said that, it's clear that we should continue to monitor its balance sheet, lest it change for the worse.
We measure a company's debt load relative to its earnings power by looking at its net debt divided by its earnings before interest, tax, depreciation, and amortization (EBITDA) and by calculating how easily its earnings before interest and tax (EBIT) cover its interest expense (interest cover). The advantage of this approach is that we take into account both the absolute quantum of debt (with net debt to EBITDA) and the actual interest expenses associated with that debt (with its interest cover ratio).
Synergy House Berhad has net debt of just 0.88 times EBITDA, indicating that it is certainly not a reckless borrower. And this view is supported by the solid interest coverage, with EBIT coming in at 9.4 times the interest expense over the last year. But the bad news is that Synergy House Berhad has seen its EBIT plunge 11% in the last twelve months. If that rate of decline in earnings continues, the company could find itself in a tight spot. When analysing debt levels, the balance sheet is the obvious place to start. But ultimately the future profitability of the business will decide if Synergy House Berhad can strengthen its balance sheet over time. So if you're focused on the future you can check out this free report showing analyst profit forecasts.
Finally, a business needs free cash flow to pay off debt; accounting profits just don't cut it. So the logical step is to look at the proportion of that EBIT that is matched by actual free cash flow. Over the last three years, Synergy House Berhad reported free cash flow worth 8.2% of its EBIT, which is really quite low. That limp level of cash conversion undermines its ability to manage and pay down debt.
Our View
Synergy House Berhad's interest cover was a real positive on this analysis, as was its net debt to EBITDA. On the other hand, its conversion of EBIT to free cash flow makes us a little less comfortable about its debt. Looking at all this data makes us feel a little cautious about Synergy House Berhad's debt levels. While debt does have its upside in higher potential returns, we think shareholders should definitely consider how debt levels might make the stock more risky. Above most other metrics, we think its important to track how fast earnings per share is growing, if at all. If you've also come to that realization, you're in luck, because today you can view this interactive graph of Synergy House Berhad's earnings per share history for free.
At the end of the day, it's often better to focus on companies that are free from net debt. You can access our special list of such companies (all with a track record of profit growth). It's free.
New: Manage All Your Stock Portfolios in One Place
We've created the ultimate portfolio companion for stock investors, and it's free.
• Connect an unlimited number of Portfolios and see your total in one currency
• Be alerted to new Warning Signs or Risks via email or mobile
• Track the Fair Value of your stocks
Have feedback on this article? Concerned about the content? Get in touch with us directly. Alternatively, email editorial-team (at) simplywallst.com.
This article by Simply Wall St is general in nature. We provide commentary based on historical data and analyst forecasts only using an unbiased methodology and our articles are not intended to be financial advice. It does not constitute a recommendation to buy or sell any stock, and does not take account of your objectives, or your financial situation. We aim to bring you long-term focused analysis driven by fundamental data. Note that our analysis may not factor in the latest price-sensitive company announcements or qualitative material. Simply Wall St has no position in any stocks mentioned.
About KLSE:SYNERGY
Synergy House Berhad
An investment holding company, engages in the design, development, sale, and trading of ready-to-assemble home furniture in Malaysia, Asia, Oceania, Europe, and the North America.
Flawless balance sheet with slight risk.
Market Insights

Advertisement
Community Narratives
MINISO's fair value is projected at 26.69 with an anticipated PE ratio shift of 20x
Fair Value US$24.03|11.0% undervalued
BE
Community Contributor
Procter & Gamble: A Dividend Giant Facing Slowing Growth
Fair Value US$119.81|23.3% overvalued
AN
Community Contributor
Eli Lilly's Future Growth Driven by Tirzepatide and Favorable Market Conditions
Fair Value US$1.19k|13.8% undervalued
EA
Community Contributor