
Advertisement
- Malaysia
- /
- Consumer Durables
- /
- KLSE:SWSCAP
SWS Capital Berhad (KLSE:SWSCAP) Hasn't Managed To Accelerate Its Returns
There are a few key trends to look for if we want to identify the next multi-bagger. Typically, we'll want to notice a trend of growing return on capital employed (ROCE) and alongside that, an expanding base of capital employed. This shows us that it's a compounding machine, able to continually reinvest its earnings back into the business and generate higher returns. Having said that, from a first glance at SWS Capital Berhad (KLSE:SWSCAP) we aren't jumping out of our chairs at how returns are trending, but let's have a deeper look.
Return On Capital Employed (ROCE): What Is It?
If you haven't worked with ROCE before, it measures the 'return' (pre-tax profit) a company generates from capital employed in its business. The formula for this calculation on SWS Capital Berhad is:
Return on Capital Employed = Earnings Before Interest and Tax (EBIT) ÷ (Total Assets - Current Liabilities)
0.038 = RM4.7m ÷ (RM197m - RM74m) (Based on the trailing twelve months to March 2022).
Thus, SWS Capital Berhad has an ROCE of 3.8%. Ultimately, that's a low return and it under-performs the Consumer Durables industry average of 10%.
Check out our latest analysis for SWS Capital Berhad
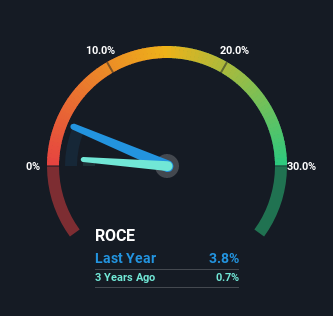
Historical performance is a great place to start when researching a stock so above you can see the gauge for SWS Capital Berhad's ROCE against it's prior returns. If you'd like to look at how SWS Capital Berhad has performed in the past in other metrics, you can view this free graph of past earnings, revenue and cash flow.
So How Is SWS Capital Berhad's ROCE Trending?
The returns on capital haven't changed much for SWS Capital Berhad in recent years. The company has consistently earned 3.8% for the last five years, and the capital employed within the business has risen 35% in that time. This poor ROCE doesn't inspire confidence right now, and with the increase in capital employed, it's evident that the business isn't deploying the funds into high return investments.
Another point to note, we noticed the company has increased current liabilities over the last five years. This is intriguing because if current liabilities hadn't increased to 38% of total assets, this reported ROCE would probably be less than3.8% because total capital employed would be higher.The 3.8% ROCE could be even lower if current liabilities weren't 38% of total assets, because the the formula would show a larger base of total capital employed. With that in mind, just be wary if this ratio increases in the future, because if it gets particularly high, this brings with it some new elements of risk.
Our Take On SWS Capital Berhad's ROCE
As we've seen above, SWS Capital Berhad's returns on capital haven't increased but it is reinvesting in the business. Moreover, since the stock has crumbled 71% over the last five years, it appears investors are expecting the worst. All in all, the inherent trends aren't typical of multi-baggers, so if that's what you're after, we think you might have more luck elsewhere.
One final note, you should learn about the 6 warning signs we've spotted with SWS Capital Berhad (including 2 which are concerning) .
While SWS Capital Berhad may not currently earn the highest returns, we've compiled a list of companies that currently earn more than 25% return on equity. Check out this free list here.
New: Manage All Your Stock Portfolios in One Place
We've created the ultimate portfolio companion for stock investors, and it's free.
• Connect an unlimited number of Portfolios and see your total in one currency
• Be alerted to new Warning Signs or Risks via email or mobile
• Track the Fair Value of your stocks
Have feedback on this article? Concerned about the content? Get in touch with us directly. Alternatively, email editorial-team (at) simplywallst.com.
This article by Simply Wall St is general in nature. We provide commentary based on historical data and analyst forecasts only using an unbiased methodology and our articles are not intended to be financial advice. It does not constitute a recommendation to buy or sell any stock, and does not take account of your objectives, or your financial situation. We aim to bring you long-term focused analysis driven by fundamental data. Note that our analysis may not factor in the latest price-sensitive company announcements or qualitative material. Simply Wall St has no position in any stocks mentioned.
About KLSE:SWSCAP
SWS Capital Berhad
An investment holding company, manufactures and sells wood furniture and plasticwares in the Asia Pacific, Europe, Malaysia, and internationally.
Flawless balance sheet and fair value.
Market Insights

Advertisement
Community Narratives
Finding The True Value Of A Logistics Powerhouse
Fair Value US$95.21|8.4% undervalued
NV
Community Contributor
Paradigm Biopharmaceuticals Will Lead Osteoarthritis Treatment with Zilosul's FDA Success
Fair Value AU$5.50|92.1% undervalued
AM
Community Contributor
Barrick Mining (ABX:CA): A Gold Hedge against a U.S. Shutdown
Fair Value CA$60.00|24.2% undervalued
GM
Community Contributor