
Advertisement
- Malaysia
- /
- Electrical
- /
- KLSE:UMSNGB
Returns On Capital At UMS-Neiken Group Berhad (KLSE:UMSNGB) Have Stalled
There are a few key trends to look for if we want to identify the next multi-bagger. One common approach is to try and find a company with returns on capital employed (ROCE) that are increasing, in conjunction with a growing amount of capital employed. Ultimately, this demonstrates that it's a business that is reinvesting profits at increasing rates of return. Although, when we looked at UMS-Neiken Group Berhad (KLSE:UMSNGB), it didn't seem to tick all of these boxes.
Understanding Return On Capital Employed (ROCE)
For those that aren't sure what ROCE is, it measures the amount of pre-tax profits a company can generate from the capital employed in its business. The formula for this calculation on UMS-Neiken Group Berhad is:
Return on Capital Employed = Earnings Before Interest and Tax (EBIT) ÷ (Total Assets - Current Liabilities)
0.097 = RM11m ÷ (RM124m - RM9.5m) (Based on the trailing twelve months to December 2021).
Thus, UMS-Neiken Group Berhad has an ROCE of 9.7%. On its own that's a low return, but compared to the average of 7.0% generated by the Electrical industry, it's much better.
Check out our latest analysis for UMS-Neiken Group Berhad
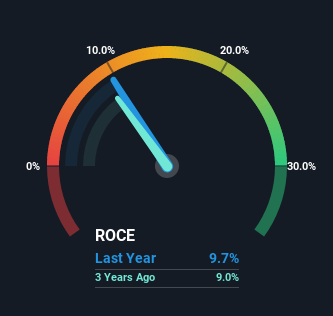
While the past is not representative of the future, it can be helpful to know how a company has performed historically, which is why we have this chart above. If you'd like to look at how UMS-Neiken Group Berhad has performed in the past in other metrics, you can view this free graph of past earnings, revenue and cash flow.
What Can We Tell From UMS-Neiken Group Berhad's ROCE Trend?
Over the past five years, UMS-Neiken Group Berhad's ROCE and capital employed have both remained mostly flat. This tells us the company isn't reinvesting in itself, so it's plausible that it's past the growth phase. So unless we see a substantial change at UMS-Neiken Group Berhad in terms of ROCE and additional investments being made, we wouldn't hold our breath on it being a multi-bagger.
The Bottom Line
We can conclude that in regards to UMS-Neiken Group Berhad's returns on capital employed and the trends, there isn't much change to report on. Unsurprisingly, the stock has only gained 8.7% over the last five years, which potentially indicates that investors are accounting for this going forward. Therefore, if you're looking for a multi-bagger, we'd propose looking at other options.
Since virtually every company faces some risks, it's worth knowing what they are, and we've spotted 3 warning signs for UMS-Neiken Group Berhad (of which 1 shouldn't be ignored!) that you should know about.
For those who like to invest in solid companies, check out this free list of companies with solid balance sheets and high returns on equity.
New: AI Stock Screener & Alerts
Our new AI Stock Screener scans the market every day to uncover opportunities.
• Dividend Powerhouses (3%+ Yield)
• Undervalued Small Caps with Insider Buying
• High growth Tech and AI Companies
Or build your own from over 50 metrics.
Have feedback on this article? Concerned about the content? Get in touch with us directly. Alternatively, email editorial-team (at) simplywallst.com.
This article by Simply Wall St is general in nature. We provide commentary based on historical data and analyst forecasts only using an unbiased methodology and our articles are not intended to be financial advice. It does not constitute a recommendation to buy or sell any stock, and does not take account of your objectives, or your financial situation. We aim to bring you long-term focused analysis driven by fundamental data. Note that our analysis may not factor in the latest price-sensitive company announcements or qualitative material. Simply Wall St has no position in any stocks mentioned.
About KLSE:UMSNGB
UMS-Neiken Group Berhad
An investment holding company, designs, manufactures, and trades in electrical wiring accessories and related electrical products in Malaysia, Vietnam, and Singapore.
Flawless balance sheet average dividend payer.
Market Insights

Advertisement
Community Narratives
MicroVision will explode future revenue by 380.37% with a vision towards success
Fair Value US$60|98.4% undervalued
TH
Community Contributor
The Indispensable Artery for a New North American Economy
Fair Value CA$132.87|0.7% overvalued
TI
Community Contributor
Recently Updated Narratives
CE

cementafriend on Constellation Energy ·
Constellation Energy Dividends and Growth
Fair Value:US$348.054.7% overvalued
2 followersusers have followed this narrative
0 commentsusers have commented on this narrative
0 likesusers have liked this narrative
KH

Khagani on CoreWeave ·
CoreWeave's Revenue Expected to Rocket 77.88% in 5-Year Forecast
Fair Value:US$11033.5% undervalued
3 followersusers have followed this narrative
0 commentsusers have commented on this narrative
0 likesusers have liked this narrative
PO

PortfolioPlus on Bisalloy Steel Group ·
Bisalloy Steel Group will shine with a projected profit margin increase of 12.8%
Fair Value:AU$6.7118.0% undervalued
3 followersusers have followed this narrative
0 commentsusers have commented on this narrative
0 likesusers have liked this narrative
Popular Narratives
TH

TheWallstreetKing on MicroVision ·
MicroVision will explode future revenue by 380.37% with a vision towards success
Fair Value:US$6098.4% undervalued
106 followersusers have followed this narrative
10 commentsusers have commented on this narrative
21 likesusers have liked this narrative
AN


AnalystConsensusTarget on NVIDIA ·
NVDA: Expanding AI Demand Will Drive Major Data Center Investments Through 2026
Fair Value:US$250.3929.3% undervalued
936 followersusers have followed this narrative
6 commentsusers have commented on this narrative
24 likesusers have liked this narrative
OS


oscargarcia on Alphabet ·
The company that turned a verb into a global necessity and basically runs the modern internet, digital ads, smartphones, maps, and AI.
Fair Value:US$3405.8% undervalued
144 followersusers have followed this narrative
6 commentsusers have commented on this narrative
18 likesusers have liked this narrative