
Advertisement
Risks Still Elevated At These Prices As SAM Engineering & Equipment (M) Berhad (KLSE:SAM) Shares Dive 27%

To the annoyance of some shareholders, SAM Engineering & Equipment (M) Berhad (KLSE:SAM) shares are down a considerable 27% in the last month, which continues a horrid run for the company. Instead of being rewarded, shareholders who have already held through the last twelve months are now sitting on a 15% share price drop.
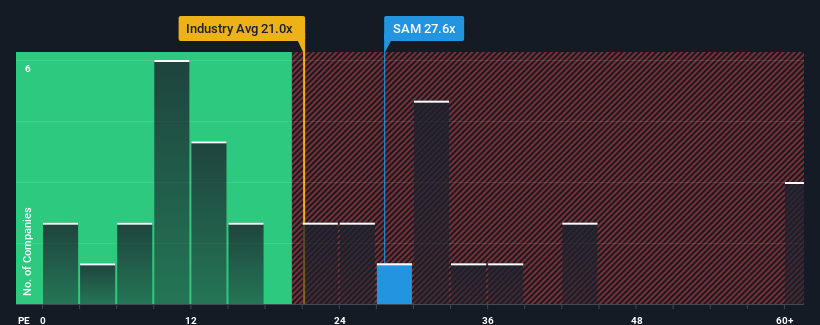
Although its price has dipped substantially, SAM Engineering & Equipment (M) Berhad's price-to-earnings (or "P/E") ratio of 27.6x might still make it look like a strong sell right now compared to the market in Malaysia, where around half of the companies have P/E ratios below 15x and even P/E's below 9x are quite common. However, the P/E might be quite high for a reason and it requires further investigation to determine if it's justified.
Recent times haven't been advantageous for SAM Engineering & Equipment (M) Berhad as its earnings have been rising slower than most other companies. It might be that many expect the uninspiring earnings performance to recover significantly, which has kept the P/E from collapsing. You'd really hope so, otherwise you're paying a pretty hefty price for no particular reason.
View our latest analysis for SAM Engineering & Equipment (M) Berhad
What Are Growth Metrics Telling Us About The High P/E?
The only time you'd be truly comfortable seeing a P/E as steep as SAM Engineering & Equipment (M) Berhad's is when the company's growth is on track to outshine the market decidedly.
Retrospectively, the last year delivered a decent 5.0% gain to the company's bottom line. EPS has also lifted 22% in aggregate from three years ago, partly thanks to the last 12 months of growth. Accordingly, shareholders would have probably been satisfied with the medium-term rates of earnings growth.
Looking ahead now, EPS is anticipated to climb by 10% each year during the coming three years according to the three analysts following the company. That's shaping up to be materially lower than the 14% per year growth forecast for the broader market.
In light of this, it's alarming that SAM Engineering & Equipment (M) Berhad's P/E sits above the majority of other companies. Apparently many investors in the company are way more bullish than analysts indicate and aren't willing to let go of their stock at any price. Only the boldest would assume these prices are sustainable as this level of earnings growth is likely to weigh heavily on the share price eventually.
The Key Takeaway
SAM Engineering & Equipment (M) Berhad's shares may have retreated, but its P/E is still flying high. We'd say the price-to-earnings ratio's power isn't primarily as a valuation instrument but rather to gauge current investor sentiment and future expectations.
Our examination of SAM Engineering & Equipment (M) Berhad's analyst forecasts revealed that its inferior earnings outlook isn't impacting its high P/E anywhere near as much as we would have predicted. When we see a weak earnings outlook with slower than market growth, we suspect the share price is at risk of declining, sending the high P/E lower. Unless these conditions improve markedly, it's very challenging to accept these prices as being reasonable.
Before you settle on your opinion, we've discovered 1 warning sign for SAM Engineering & Equipment (M) Berhad that you should be aware of.
You might be able to find a better investment than SAM Engineering & Equipment (M) Berhad. If you want a selection of possible candidates, check out this free list of interesting companies that trade on a low P/E (but have proven they can grow earnings).
New: Manage All Your Stock Portfolios in One Place
We've created the ultimate portfolio companion for stock investors, and it's free.
• Connect an unlimited number of Portfolios and see your total in one currency
• Be alerted to new Warning Signs or Risks via email or mobile
• Track the Fair Value of your stocks
Have feedback on this article? Concerned about the content? Get in touch with us directly. Alternatively, email editorial-team (at) simplywallst.com.
This article by Simply Wall St is general in nature. We provide commentary based on historical data and analyst forecasts only using an unbiased methodology and our articles are not intended to be financial advice. It does not constitute a recommendation to buy or sell any stock, and does not take account of your objectives, or your financial situation. We aim to bring you long-term focused analysis driven by fundamental data. Note that our analysis may not factor in the latest price-sensitive company announcements or qualitative material. Simply Wall St has no position in any stocks mentioned.
About KLSE:SAM
SAM Engineering & Equipment (M) Berhad
An investment holding company, engages in the aerospace and equipment manufacturing businesses in Malaysia, rest of Asia, North and Latin America, and Europe.
Flawless balance sheet with reasonable growth potential.
Market Insights

Advertisement
Community Narratives
Groundbreaking therapies that could change the treatment landscape for PTSD, fibromyalgia, MS & Alzheimer’s
Fair Value US$6.20|86.9% undervalued
CM
Community Contributor
DigitalOcean Will Grow 14% by Embracing AI with Paperspace Acquisition
Fair Value US$50.00|41.7% undervalued
NE
Community Contributor
Viant Technology: A Rising AdTech Challenger in the AI-Powered CTV Market
Fair Value US$38.61|63.2% undervalued
BL
Community Contributor
Volvo will Accelerate Forward into Electric and Autonomous Leadership in Five Years
Fair Value SEK 438.80|39.7% undervalued
UN
Community Contributor