- Malaysia
- /
- Trade Distributors
- /
- KLSE:PLYTEC
Investors Shouldn't Be Too Comfortable With PLYTEC Holding Berhad's (KLSE:PLYTEC) Earnings


PLYTEC Holding Berhad (KLSE:PLYTEC) announced strong profits, but the stock was stagnant. Our analysis suggests that shareholders have noticed something concerning in the numbers.
View our latest analysis for PLYTEC Holding Berhad
Examining Cashflow Against PLYTEC Holding Berhad's Earnings
In high finance, the key ratio used to measure how well a company converts reported profits into free cash flow (FCF) is the accrual ratio (from cashflow). To get the accrual ratio we first subtract FCF from profit for a period, and then divide that number by the average operating assets for the period. The ratio shows us how much a company's profit exceeds its FCF.
That means a negative accrual ratio is a good thing, because it shows that the company is bringing in more free cash flow than its profit would suggest. While it's not a problem to have a positive accrual ratio, indicating a certain level of non-cash profits, a high accrual ratio is arguably a bad thing, because it indicates paper profits are not matched by cash flow. To quote a 2014 paper by Lewellen and Resutek, "firms with higher accruals tend to be less profitable in the future".
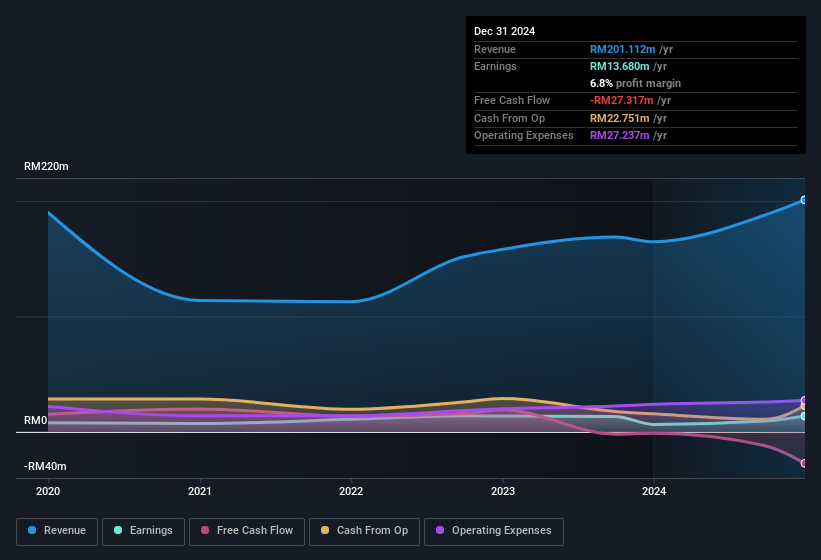
PLYTEC Holding Berhad has an accrual ratio of 0.23 for the year to December 2024. Therefore, we know that it's free cashflow was significantly lower than its statutory profit, which is hardly a good thing. Over the last year it actually had negative free cash flow of RM27m, in contrast to the aforementioned profit of RM13.7m. Coming off the back of negative free cash flow last year, we imagine some shareholders might wonder if its cash burn of RM27m, this year, indicates high risk.
Note: we always recommend investors check balance sheet strength. Click here to be taken to our balance sheet analysis of PLYTEC Holding Berhad.
Our Take On PLYTEC Holding Berhad's Profit Performance
PLYTEC Holding Berhad didn't convert much of its profit to free cash flow in the last year, which some investors may consider rather suboptimal. Therefore, it seems possible to us that PLYTEC Holding Berhad's true underlying earnings power is actually less than its statutory profit. But at least holders can take some solace from the 79% EPS growth in the last year. At the end of the day, it's essential to consider more than just the factors above, if you want to understand the company properly. If you want to do dive deeper into PLYTEC Holding Berhad, you'd also look into what risks it is currently facing. For example, we've found that PLYTEC Holding Berhad has 4 warning signs (1 is concerning!) that deserve your attention before going any further with your analysis.
Today we've zoomed in on a single data point to better understand the nature of PLYTEC Holding Berhad's profit. But there is always more to discover if you are capable of focussing your mind on minutiae. For example, many people consider a high return on equity as an indication of favorable business economics, while others like to 'follow the money' and search out stocks that insiders are buying. While it might take a little research on your behalf, you may find this free collection of companies boasting high return on equity, or this list of stocks with significant insider holdings to be useful.
New: Manage All Your Stock Portfolios in One Place
We've created the ultimate portfolio companion for stock investors, and it's free.
• Connect an unlimited number of Portfolios and see your total in one currency
• Be alerted to new Warning Signs or Risks via email or mobile
• Track the Fair Value of your stocks
Have feedback on this article? Concerned about the content? Get in touch with us directly. Alternatively, email editorial-team (at) simplywallst.com.
This article by Simply Wall St is general in nature. We provide commentary based on historical data and analyst forecasts only using an unbiased methodology and our articles are not intended to be financial advice. It does not constitute a recommendation to buy or sell any stock, and does not take account of your objectives, or your financial situation. We aim to bring you long-term focused analysis driven by fundamental data. Note that our analysis may not factor in the latest price-sensitive company announcements or qualitative material. Simply Wall St has no position in any stocks mentioned.
About KLSE:PLYTEC
PLYTEC Holding Berhad
An investment holding company, provides construction engineering solutions and services primarily in Malaysia.
Excellent balance sheet with proven track record.
Market Insights

Community Narratives

