- Malaysia
- /
- Electrical
- /
- KLSE:MTEC
Master Tec Group Berhad's (KLSE:MTEC) Fundamentals Look Pretty Strong: Could The Market Be Wrong About The Stock?

It is hard to get excited after looking at Master Tec Group Berhad's (KLSE:MTEC) recent performance, when its stock has declined 13% over the past week. However, stock prices are usually driven by a company’s financial performance over the long term, which in this case looks quite promising. Specifically, we decided to study Master Tec Group Berhad's ROE in this article.
Return on equity or ROE is a key measure used to assess how efficiently a company's management is utilizing the company's capital. In short, ROE shows the profit each dollar generates with respect to its shareholder investments.
View our latest analysis for Master Tec Group Berhad
How Is ROE Calculated?
The formula for ROE is:
Return on Equity = Net Profit (from continuing operations) ÷ Shareholders' Equity
So, based on the above formula, the ROE for Master Tec Group Berhad is:
13% = RM24m ÷ RM178m (Based on the trailing twelve months to September 2024).
The 'return' is the profit over the last twelve months. That means that for every MYR1 worth of shareholders' equity, the company generated MYR0.13 in profit.
What Has ROE Got To Do With Earnings Growth?
We have already established that ROE serves as an efficient profit-generating gauge for a company's future earnings. Based on how much of its profits the company chooses to reinvest or "retain", we are then able to evaluate a company's future ability to generate profits. Assuming everything else remains unchanged, the higher the ROE and profit retention, the higher the growth rate of a company compared to companies that don't necessarily bear these characteristics.
Master Tec Group Berhad's Earnings Growth And 13% ROE
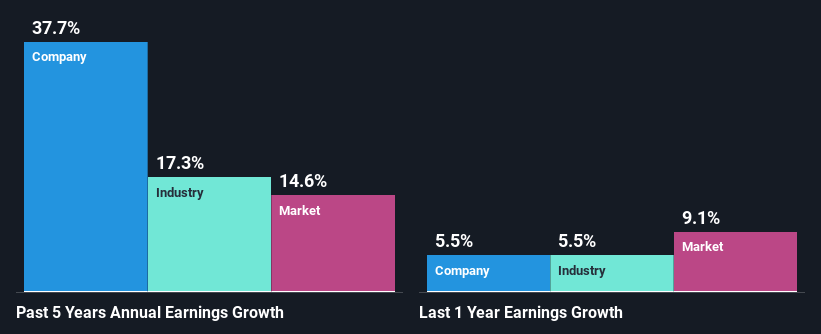
At first glance, Master Tec Group Berhad seems to have a decent ROE. On comparing with the average industry ROE of 8.4% the company's ROE looks pretty remarkable. This certainly adds some context to Master Tec Group Berhad's exceptional 38% net income growth seen over the past five years. However, there could also be other causes behind this growth. For instance, the company has a low payout ratio or is being managed efficiently.
Next, on comparing with the industry net income growth, we found that Master Tec Group Berhad's growth is quite high when compared to the industry average growth of 17% in the same period, which is great to see.
Earnings growth is an important metric to consider when valuing a stock. What investors need to determine next is if the expected earnings growth, or the lack of it, is already built into the share price. This then helps them determine if the stock is placed for a bright or bleak future. One good indicator of expected earnings growth is the P/E ratio which determines the price the market is willing to pay for a stock based on its earnings prospects. So, you may want to check if Master Tec Group Berhad is trading on a high P/E or a low P/E, relative to its industry.
Is Master Tec Group Berhad Using Its Retained Earnings Effectively?
The high three-year median payout ratio of 50% (implying that it keeps only 50% of profits) for Master Tec Group Berhad suggests that the company's growth wasn't really hampered despite it returning most of the earnings to its shareholders.
While Master Tec Group Berhad has been growing its earnings, it only recently started to pay dividends which likely means that the company decided to impress new and existing shareholders with a dividend.
Conclusion
On the whole, we feel that Master Tec Group Berhad's performance has been quite good. We are particularly impressed by the considerable earnings growth posted by the company, which was likely backed by its high ROE. While the company is paying out most of its earnings as dividends, it has been able to grow its earnings in spite of it, so that's probably a good sign. Until now, we have only just grazed the surface of the company's past performance by looking at the company's fundamentals. You can do your own research on Master Tec Group Berhad and see how it has performed in the past by looking at this FREE detailed graph of past earnings, revenue and cash flows.
The New Payments ETF Is Live on NASDAQ:
Money is moving to real-time rails, and a newly listed ETF now gives investors direct exposure. Fast settlement. Institutional custody. Simple access.
Explore how this launch could reshape portfolios
Sponsored ContentNew: Manage All Your Stock Portfolios in One Place
We've created the ultimate portfolio companion for stock investors, and it's free.
• Connect an unlimited number of Portfolios and see your total in one currency
• Be alerted to new Warning Signs or Risks via email or mobile
• Track the Fair Value of your stocks
Have feedback on this article? Concerned about the content? Get in touch with us directly. Alternatively, email editorial-team (at) simplywallst.com.
This article by Simply Wall St is general in nature. We provide commentary based on historical data and analyst forecasts only using an unbiased methodology and our articles are not intended to be financial advice. It does not constitute a recommendation to buy or sell any stock, and does not take account of your objectives, or your financial situation. We aim to bring you long-term focused analysis driven by fundamental data. Note that our analysis may not factor in the latest price-sensitive company announcements or qualitative material. Simply Wall St has no position in any stocks mentioned.
About KLSE:MTEC
Master Tec Group Berhad
Through its subsidiary, Master Tec Wire & Cable Sdn Bhd, engages in the manufacturing and distribution of power cables, control and instrumentation cables, and other related products in Malaysia and internationally.
Adequate balance sheet with acceptable track record.
Similar Companies
Market Insights

Weekly Picks

Early mover in a fast growing industry. Likely to experience share price volatility as they scale


A case for CA$31.80 (undiluted), aka 8,616% upside from CA$0.37 (an 86 bagger!).


Moderation and Stabilisation: HOLD: Fair Price based on a 4-year Cycle is $12.08
Recently Updated Narratives


An amazing opportunity to potentially get a 100 bagger

Amazon: Why the World’s Biggest Platform Still Runs on Invisible Economics

Sunrun Stock: When the Energy Transition Collides With the Cost of Capital
Popular Narratives


MicroVision will explode future revenue by 380.37% with a vision towards success


Crazy Undervalued 42 Baggers Silver Play (Active & Running Mine)


NVDA: Expanding AI Demand Will Drive Major Data Center Investments Through 2026
Trending Discussion
