- Malaysia
- /
- Construction
- /
- KLSE:GBGAQRS
Does This Valuation Of Gabungan AQRS Berhad (KLSE:GBGAQRS) Imply Investors Are Overpaying?


Key Insights
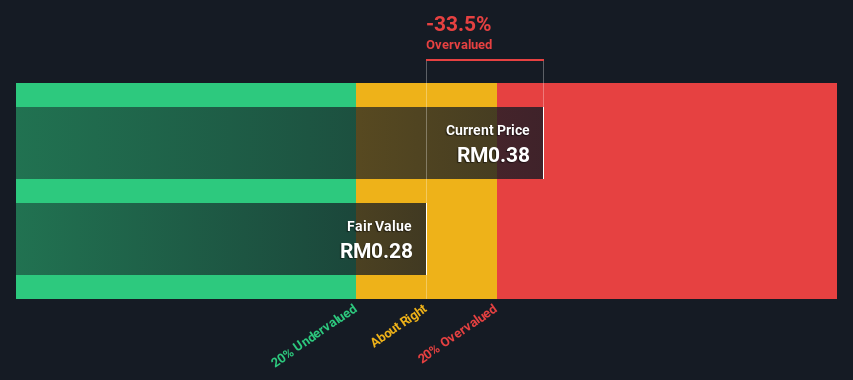
- Gabungan AQRS Berhad's estimated fair value is RM0.28 based on 2 Stage Free Cash Flow to Equity
- Current share price of RM0.38 suggests Gabungan AQRS Berhad is potentially 33% overvalued
- When compared to theindustry average discount of -19,607%, Gabungan AQRS Berhad's competitors seem to be trading at a greater premium to fair value
How far off is Gabungan AQRS Berhad (KLSE:GBGAQRS) from its intrinsic value? Using the most recent financial data, we'll take a look at whether the stock is fairly priced by taking the expected future cash flows and discounting them to today's value. We will use the Discounted Cash Flow (DCF) model on this occasion. Believe it or not, it's not too difficult to follow, as you'll see from our example!
Remember though, that there are many ways to estimate a company's value, and a DCF is just one method. Anyone interested in learning a bit more about intrinsic value should have a read of the Simply Wall St analysis model.
Check out our latest analysis for Gabungan AQRS Berhad
The Model
We're using the 2-stage growth model, which simply means we take in account two stages of company's growth. In the initial period the company may have a higher growth rate and the second stage is usually assumed to have a stable growth rate. To begin with, we have to get estimates of the next ten years of cash flows. Seeing as no analyst estimates of free cash flow are available to us, we have extrapolate the previous free cash flow (FCF) from the company's last reported value. We assume companies with shrinking free cash flow will slow their rate of shrinkage, and that companies with growing free cash flow will see their growth rate slow, over this period. We do this to reflect that growth tends to slow more in the early years than it does in later years.
A DCF is all about the idea that a dollar in the future is less valuable than a dollar today, so we need to discount the sum of these future cash flows to arrive at a present value estimate:
10-year free cash flow (FCF) forecast
| 2024 | 2025 | 2026 | 2027 | 2028 | 2029 | 2030 | 2031 | 2032 | 2033 | |
| Levered FCF (MYR, Millions) | RM12.3m | RM14.5m | RM16.4m | RM18.1m | RM19.6m | RM20.9m | RM22.1m | RM23.3m | RM24.4m | RM25.4m |
| Growth Rate Estimate Source | Est @ 23.25% | Est @ 17.34% | Est @ 13.20% | Est @ 10.31% | Est @ 8.28% | Est @ 6.86% | Est @ 5.87% | Est @ 5.17% | Est @ 4.69% | Est @ 4.34% |
| Present Value (MYR, Millions) Discounted @ 15% | RM10.8 | RM11.0 | RM10.9 | RM10.5 | RM9.9 | RM9.3 | RM8.6 | RM7.9 | RM7.2 | RM6.6 |
("Est" = FCF growth rate estimated by Simply Wall St)
Present Value of 10-year Cash Flow (PVCF) = RM93m
The second stage is also known as Terminal Value, this is the business's cash flow after the first stage. The Gordon Growth formula is used to calculate Terminal Value at a future annual growth rate equal to the 5-year average of the 10-year government bond yield of 3.6%. We discount the terminal cash flows to today's value at a cost of equity of 15%.
Terminal Value (TV)= FCF2033 × (1 + g) ÷ (r – g) = RM25m× (1 + 3.6%) ÷ (15%– 3.6%) = RM240m
Present Value of Terminal Value (PVTV)= TV / (1 + r)10= RM240m÷ ( 1 + 15%)10= RM62m
The total value, or equity value, is then the sum of the present value of the future cash flows, which in this case is RM155m. In the final step we divide the equity value by the number of shares outstanding. Relative to the current share price of RM0.4, the company appears reasonably expensive at the time of writing. Valuations are imprecise instruments though, rather like a telescope - move a few degrees and end up in a different galaxy. Do keep this in mind.
The Assumptions
Now the most important inputs to a discounted cash flow are the discount rate, and of course, the actual cash flows. Part of investing is coming up with your own evaluation of a company's future performance, so try the calculation yourself and check your own assumptions. The DCF also does not consider the possible cyclicality of an industry, or a company's future capital requirements, so it does not give a full picture of a company's potential performance. Given that we are looking at Gabungan AQRS Berhad as potential shareholders, the cost of equity is used as the discount rate, rather than the cost of capital (or weighted average cost of capital, WACC) which accounts for debt. In this calculation we've used 15%, which is based on a levered beta of 1.727. Beta is a measure of a stock's volatility, compared to the market as a whole. We get our beta from the industry average beta of globally comparable companies, with an imposed limit between 0.8 and 2.0, which is a reasonable range for a stable business.
SWOT Analysis for Gabungan AQRS Berhad
- Net debt to equity ratio below 40%.
- Earnings declined over the past year.
- Interest payments on debt are not well covered.
- Annual earnings are forecast to grow faster than the Malaysian market.
- Good value based on P/E ratio compared to estimated Fair P/E ratio.
- Debt is not well covered by operating cash flow.
Moving On:
Whilst important, the DCF calculation shouldn't be the only metric you look at when researching a company. It's not possible to obtain a foolproof valuation with a DCF model. Rather it should be seen as a guide to "what assumptions need to be true for this stock to be under/overvalued?" For instance, if the terminal value growth rate is adjusted slightly, it can dramatically alter the overall result. Why is the intrinsic value lower than the current share price? For Gabungan AQRS Berhad, we've compiled three pertinent aspects you should consider:
- Risks: Be aware that Gabungan AQRS Berhad is showing 1 warning sign in our investment analysis , you should know about...
- Future Earnings: How does GBGAQRS's growth rate compare to its peers and the wider market? Dig deeper into the analyst consensus number for the upcoming years by interacting with our free analyst growth expectation chart.
- Other High Quality Alternatives: Do you like a good all-rounder? Explore our interactive list of high quality stocks to get an idea of what else is out there you may be missing!
PS. Simply Wall St updates its DCF calculation for every Malaysian stock every day, so if you want to find the intrinsic value of any other stock just search here.
New: Manage All Your Stock Portfolios in One Place
We've created the ultimate portfolio companion for stock investors, and it's free.
• Connect an unlimited number of Portfolios and see your total in one currency
• Be alerted to new Warning Signs or Risks via email or mobile
• Track the Fair Value of your stocks
Have feedback on this article? Concerned about the content? Get in touch with us directly. Alternatively, email editorial-team (at) simplywallst.com.
This article by Simply Wall St is general in nature. We provide commentary based on historical data and analyst forecasts only using an unbiased methodology and our articles are not intended to be financial advice. It does not constitute a recommendation to buy or sell any stock, and does not take account of your objectives, or your financial situation. We aim to bring you long-term focused analysis driven by fundamental data. Note that our analysis may not factor in the latest price-sensitive company announcements or qualitative material. Simply Wall St has no position in any stocks mentioned.
About KLSE:GBGAQRS
Gabungan AQRS Berhad
An investment holding company, engages in development and construction of property in Malaysia.
High growth potential with mediocre balance sheet.
Market Insights

Community Narratives

