
Advertisement
David Iben put it well when he said, 'Volatility is not a risk we care about. What we care about is avoiding the permanent loss of capital.' So it seems the smart money knows that debt - which is usually involved in bankruptcies - is a very important factor, when you assess how risky a company is. Importantly, Fajarbaru Builder Group Bhd. (KLSE:FAJAR) does carry debt. But should shareholders be worried about its use of debt?
When Is Debt Dangerous?
Debt and other liabilities become risky for a business when it cannot easily fulfill those obligations, either with free cash flow or by raising capital at an attractive price. Ultimately, if the company can't fulfill its legal obligations to repay debt, shareholders could walk away with nothing. However, a more common (but still painful) scenario is that it has to raise new equity capital at a low price, thus permanently diluting shareholders. Of course, plenty of companies use debt to fund growth, without any negative consequences. When we examine debt levels, we first consider both cash and debt levels, together.
See our latest analysis for Fajarbaru Builder Group Bhd
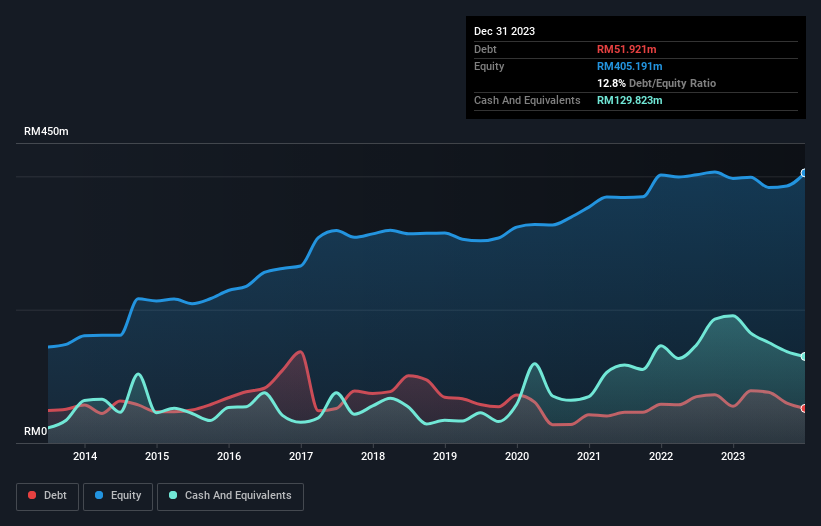
What Is Fajarbaru Builder Group Bhd's Net Debt?
The image below, which you can click on for greater detail, shows that Fajarbaru Builder Group Bhd had debt of RM51.9m at the end of December 2023, a reduction from RM55.0m over a year. But on the other hand it also has RM129.8m in cash, leading to a RM77.9m net cash position.
A Look At Fajarbaru Builder Group Bhd's Liabilities
We can see from the most recent balance sheet that Fajarbaru Builder Group Bhd had liabilities of RM156.1m falling due within a year, and liabilities of RM23.1m due beyond that. On the other hand, it had cash of RM129.8m and RM161.8m worth of receivables due within a year. So it actually has RM112.4m more liquid assets than total liabilities.
This excess liquidity is a great indication that Fajarbaru Builder Group Bhd's balance sheet is almost as strong as Fort Knox. With this in mind one could posit that its balance sheet means the company is able to handle some adversity. Simply put, the fact that Fajarbaru Builder Group Bhd has more cash than debt is arguably a good indication that it can manage its debt safely. There's no doubt that we learn most about debt from the balance sheet. But it is Fajarbaru Builder Group Bhd's earnings that will influence how the balance sheet holds up in the future. So when considering debt, it's definitely worth looking at the earnings trend. Click here for an interactive snapshot.
Over 12 months, Fajarbaru Builder Group Bhd reported revenue of RM319m, which is a gain of 48%, although it did not report any earnings before interest and tax. With any luck the company will be able to grow its way to profitability.
So How Risky Is Fajarbaru Builder Group Bhd?
Although Fajarbaru Builder Group Bhd had an earnings before interest and tax (EBIT) loss over the last twelve months, it made a statutory profit of RM4.5m. So taking that on face value, and considering the cash, we don't think its very risky in the near term. Keeping in mind its 48% revenue growth over the last year, we think there's a decent chance the company is on track. We'd see further strong growth as an optimistic indication. The balance sheet is clearly the area to focus on when you are analysing debt. But ultimately, every company can contain risks that exist outside of the balance sheet. We've identified 4 warning signs with Fajarbaru Builder Group Bhd (at least 1 which is a bit unpleasant) , and understanding them should be part of your investment process.
Of course, if you're the type of investor who prefers buying stocks without the burden of debt, then don't hesitate to discover our exclusive list of net cash growth stocks, today.
New: AI Stock Screener & Alerts
Our new AI Stock Screener scans the market every day to uncover opportunities.
• Dividend Powerhouses (3%+ Yield)
• Undervalued Small Caps with Insider Buying
• High growth Tech and AI Companies
Or build your own from over 50 metrics.
Have feedback on this article? Concerned about the content? Get in touch with us directly. Alternatively, email editorial-team (at) simplywallst.com.
This article by Simply Wall St is general in nature. We provide commentary based on historical data and analyst forecasts only using an unbiased methodology and our articles are not intended to be financial advice. It does not constitute a recommendation to buy or sell any stock, and does not take account of your objectives, or your financial situation. We aim to bring you long-term focused analysis driven by fundamental data. Note that our analysis may not factor in the latest price-sensitive company announcements or qualitative material. Simply Wall St has no position in any stocks mentioned.
About KLSE:FBG
FBG Holdings Berhad
An investment holding company, engages in the civil, infrastructure, and building construction works in Malaysia.
Established dividend payer with moderate risk.
Market Insights


Advertisement
Community Narratives
The Next Phase of Energy Storage: How NeoVolta Is Tackling America’s Power Crunch
Fair Value US$7.50|35.6% undervalued
MA
Community Contributor
Why EnSilica is Worth Possibly 13x its Current Price
Fair Value UK£5.00|90.0% undervalued
DO
Community Contributor
M&A Activity, Industry Diversification & A Defense Contract Monopoly Will Push BWXT For Healthy Long-Term Growth
Fair Value US$220.00|14.9% undervalued
CL
Community Contributor
A case for Cassiar Gold Corp (TSXV: GLDC) to reach CAD$8-10 before 2030 (X30-37)
Fair Value CA$10.00|97.2% undervalued
AG
Community Contributor