- Malaysia
- /
- Construction
- /
- KLSE:EKOVEST
Here's How P/E Ratios Can Help Us Understand Ekovest Berhad (KLSE:EKOVEST)


The goal of this article is to teach you how to use price to earnings ratios (P/E ratios). We'll look at Ekovest Berhad's (KLSE:EKOVEST) P/E ratio and reflect on what it tells us about the company's share price. What is Ekovest Berhad's P/E ratio? Well, based on the last twelve months it is 11.47. That corresponds to an earnings yield of approximately 8.7%.
View our latest analysis for Ekovest Berhad
How Do I Calculate A Price To Earnings Ratio?
The formula for P/E is:
Price to Earnings Ratio = Share Price ÷ Earnings per Share (EPS)
Or for Ekovest Berhad:
P/E of 11.47 = MYR0.80 ÷ MYR0.07 (Based on the trailing twelve months to September 2019.)
Is A High P/E Ratio Good?
A higher P/E ratio implies that investors pay a higher price for the earning power of the business. That isn't necessarily good or bad, but a high P/E implies relatively high expectations of what a company can achieve in the future.
Does Ekovest Berhad Have A Relatively High Or Low P/E For Its Industry?
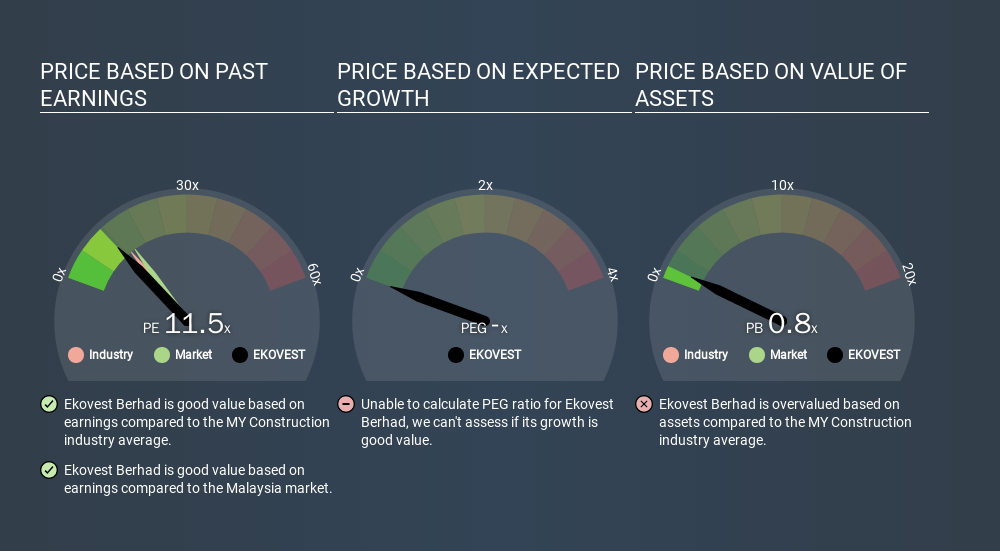
The P/E ratio essentially measures market expectations of a company. The image below shows that Ekovest Berhad has a lower P/E than the average (13.7) P/E for companies in the construction industry.
This suggests that market participants think Ekovest Berhad will underperform other companies in its industry. While current expectations are low, the stock could be undervalued if the situation is better than the market assumes. If you consider the stock interesting, further research is recommended. For example, I often monitor director buying and selling.
How Growth Rates Impact P/E Ratios
Companies that shrink earnings per share quickly will rapidly decrease the 'E' in the equation. Therefore, even if you pay a low multiple of earnings now, that multiple will become higher in the future. A higher P/E should indicate the stock is expensive relative to others -- and that may encourage shareholders to sell.
Ekovest Berhad increased earnings per share by an impressive 14% over the last twelve months. And it has bolstered its earnings per share by 21% per year over the last five years. This could arguably justify a relatively high P/E ratio. But earnings per share are down 8.4% per year over the last three years.
Don't Forget: The P/E Does Not Account For Debt or Bank Deposits
The 'Price' in P/E reflects the market capitalization of the company. In other words, it does not consider any debt or cash that the company may have on the balance sheet. Hypothetically, a company could reduce its future P/E ratio by spending its cash (or taking on debt) to achieve higher earnings.
While growth expenditure doesn't always pay off, the point is that it is a good option to have; but one that the P/E ratio ignores.
So What Does Ekovest Berhad's Balance Sheet Tell Us?
Net debt totals a substantial 141% of Ekovest Berhad's market cap. This is a relatively high level of debt, so the stock probably deserves a relatively low P/E ratio. Keep that in mind when comparing it to other companies.
The Verdict On Ekovest Berhad's P/E Ratio
Ekovest Berhad trades on a P/E ratio of 11.5, which is below the MY market average of 14.4. The company has a meaningful amount of debt on the balance sheet, but that should not eclipse the solid earnings growth. If it continues to grow, then the current low P/E may prove to be unjustified.
When the market is wrong about a stock, it gives savvy investors an opportunity. If the reality for a company is not as bad as the P/E ratio indicates, then the share price should increase as the market realizes this. Although we don't have analyst forecasts shareholders might want to examine this detailed historical graph of earnings, revenue and cash flow.
You might be able to find a better buy than Ekovest Berhad. If you want a selection of possible winners, check out this free list of interesting companies that trade on a P/E below 20 (but have proven they can grow earnings).
If you spot an error that warrants correction, please contact the editor at editorial-team@simplywallst.com. This article by Simply Wall St is general in nature. It does not constitute a recommendation to buy or sell any stock, and does not take account of your objectives, or your financial situation. Simply Wall St has no position in the stocks mentioned.
We aim to bring you long-term focused research analysis driven by fundamental data. Note that our analysis may not factor in the latest price-sensitive company announcements or qualitative material. Thank you for reading.
About KLSE:EKOVEST
Ekovest Berhad
An investment holding company, engages in civil engineering and building works in Malaysia, the United States, Japan, and the People’s Republic of China.
Undervalued minimal.

