
Advertisement
- Malaysia
- /
- Trade Distributors
- /
- KLSE:CHINHIN
The Returns On Capital At Chin Hin Group Berhad (KLSE:CHINHIN) Don't Inspire Confidence

If you're not sure where to start when looking for the next multi-bagger, there are a few key trends you should keep an eye out for. One common approach is to try and find a company with returns on capital employed (ROCE) that are increasing, in conjunction with a growing amount of capital employed. Basically this means that a company has profitable initiatives that it can continue to reinvest in, which is a trait of a compounding machine. In light of that, when we looked at Chin Hin Group Berhad (KLSE:CHINHIN) and its ROCE trend, we weren't exactly thrilled.
Return On Capital Employed (ROCE): What Is It?
For those who don't know, ROCE is a measure of a company's yearly pre-tax profit (its return), relative to the capital employed in the business. The formula for this calculation on Chin Hin Group Berhad is:
Return on Capital Employed = Earnings Before Interest and Tax (EBIT) ÷ (Total Assets - Current Liabilities)
0.033 = RM61m ÷ (RM3.1b - RM1.3b) (Based on the trailing twelve months to March 2024).
Therefore, Chin Hin Group Berhad has an ROCE of 3.3%. In absolute terms, that's a low return and it also under-performs the Trade Distributors industry average of 9.1%.
Check out our latest analysis for Chin Hin Group Berhad
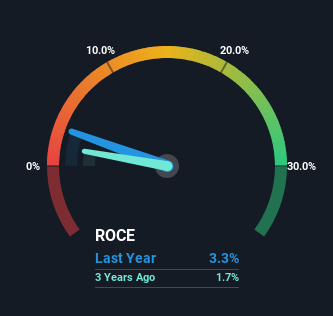
Historical performance is a great place to start when researching a stock so above you can see the gauge for Chin Hin Group Berhad's ROCE against it's prior returns. If you want to delve into the historical earnings , check out these free graphs detailing revenue and cash flow performance of Chin Hin Group Berhad.
What Does the ROCE Trend For Chin Hin Group Berhad Tell Us?
On the surface, the trend of ROCE at Chin Hin Group Berhad doesn't inspire confidence. To be more specific, ROCE has fallen from 8.6% over the last five years. Although, given both revenue and the amount of assets employed in the business have increased, it could suggest the company is investing in growth, and the extra capital has led to a short-term reduction in ROCE. And if the increased capital generates additional returns, the business, and thus shareholders, will benefit in the long run.
On a related note, Chin Hin Group Berhad has decreased its current liabilities to 41% of total assets. That could partly explain why the ROCE has dropped. What's more, this can reduce some aspects of risk to the business because now the company's suppliers or short-term creditors are funding less of its operations. Some would claim this reduces the business' efficiency at generating ROCE since it is now funding more of the operations with its own money. Either way, they're still at a pretty high level, so we'd like to see them fall further if possible.
The Bottom Line
Even though returns on capital have fallen in the short term, we find it promising that revenue and capital employed have both increased for Chin Hin Group Berhad. And the stock has done incredibly well with a 2,605% return over the last five years, so long term investors are no doubt ecstatic with that result. So while the underlying trends could already be accounted for by investors, we still think this stock is worth looking into further.
One final note, you should learn about the 2 warning signs we've spotted with Chin Hin Group Berhad (including 1 which is potentially serious) .
If you want to search for solid companies with great earnings, check out this free list of companies with good balance sheets and impressive returns on equity.
New: AI Stock Screener & Alerts
Our new AI Stock Screener scans the market every day to uncover opportunities.
• Dividend Powerhouses (3%+ Yield)
• Undervalued Small Caps with Insider Buying
• High growth Tech and AI Companies
Or build your own from over 50 metrics.
Have feedback on this article? Concerned about the content? Get in touch with us directly. Alternatively, email editorial-team (at) simplywallst.com.
This article by Simply Wall St is general in nature. We provide commentary based on historical data and analyst forecasts only using an unbiased methodology and our articles are not intended to be financial advice. It does not constitute a recommendation to buy or sell any stock, and does not take account of your objectives, or your financial situation. We aim to bring you long-term focused analysis driven by fundamental data. Note that our analysis may not factor in the latest price-sensitive company announcements or qualitative material. Simply Wall St has no position in any stocks mentioned.
Have feedback on this article? Concerned about the content? Get in touch with us directly. Alternatively, email editorial-team@simplywallst.com
About KLSE:CHINHIN
Adequate balance sheet with questionable track record.
Similar Companies
Market Insights


Advertisement
Community Narratives
A case for TSXV:USA to reach USD $5.00 - $9.00 (CAD $7.30–$12.29) by 2029.
Fair Value CA$12.29|91.1% undervalued
AG
Community Contributor
DLocal's Future Growth Fueled by 35% Revenue and Profit Margin Boosts
Fair Value US$195.39|94.2% undervalued
WY
Community Contributor
Historically Cheap, but the Margin of Safety Is Still Thin
Fair Value SEK 232.58|13.2% undervalued
MA
Community Contributor