
Advertisement
- Malaysia
- /
- Trade Distributors
- /
- KLSE:BCMALL
Reflecting on BCM Alliance Berhad's (KLSE:BCMALL) Share Price Returns Over The Last Year
Passive investing in an index fund is a good way to ensure your own returns roughly match the overall market. But if you buy individual stocks, you can do both better or worse than that. Investors in BCM Alliance Berhad (KLSE:BCMALL) have tasted that bitter downside in the last year, as the share price dropped 31%. That's well below the market return of 5.6%. At least the damage isn't so bad if you look at the last three years, since the stock is down 6.9% in that time. The falls have accelerated recently, with the share price down 20% in the last three months.
See our latest analysis for BCM Alliance Berhad
There is no denying that markets are sometimes efficient, but prices do not always reflect underlying business performance. One way to examine how market sentiment has changed over time is to look at the interaction between a company's share price and its earnings per share (EPS).
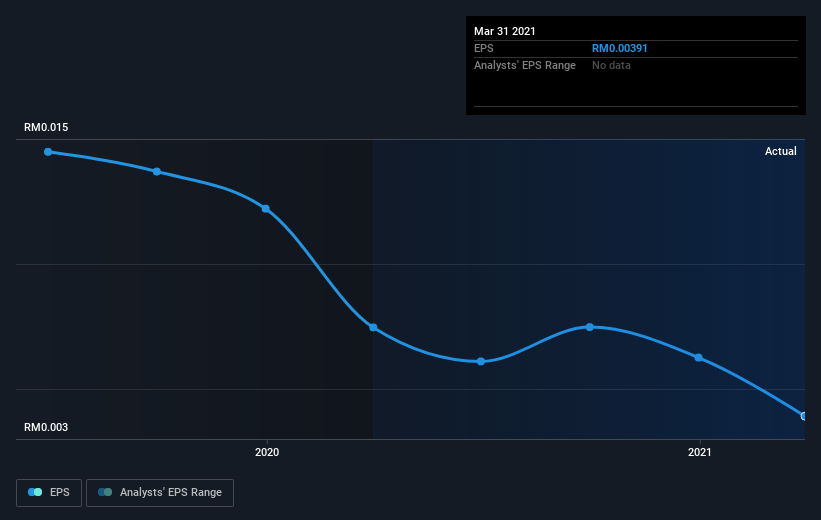
Unfortunately BCM Alliance Berhad reported an EPS drop of 48% for the last year. The share price fall of 31% isn't as bad as the reduction in earnings per share. So despite the weak per-share profits, some investors are probably relieved the situation wasn't more difficult.
The graphic below depicts how EPS has changed over time (unveil the exact values by clicking on the image).
We're pleased to report that the CEO is remunerated more modestly than most CEOs at similarly capitalized companies. It's always worth keeping an eye on CEO pay, but a more important question is whether the company will grow earnings throughout the years. Dive deeper into the earnings by checking this interactive graph of BCM Alliance Berhad's earnings, revenue and cash flow.
What about the Total Shareholder Return (TSR)?
We'd be remiss not to mention the difference between BCM Alliance Berhad's total shareholder return (TSR) and its share price return. The TSR is a return calculation that accounts for the value of cash dividends (assuming that any dividend received was reinvested) and the calculated value of any discounted capital raisings and spin-offs. Its history of dividend payouts mean that BCM Alliance Berhad's TSR, which was a 12% drop over the last year, was not as bad as the share price return.
A Different Perspective
BCM Alliance Berhad shareholders are down 12% for the year, but the broader market is up 5.6%. Of course the long term matters more than the short term, and even great stocks will sometimes have a poor year. Investors are up over three years, booking 6% per year, much better than the more recent returns. Sometimes when a good quality long term winner has a weak period, it's turns out to be an opportunity, but you really need to be sure that the quality is there. While it is well worth considering the different impacts that market conditions can have on the share price, there are other factors that are even more important. Consider for instance, the ever-present spectre of investment risk. We've identified 4 warning signs with BCM Alliance Berhad (at least 1 which can't be ignored) , and understanding them should be part of your investment process.
If you would prefer to check out another company -- one with potentially superior financials -- then do not miss this free list of companies that have proven they can grow earnings.
Please note, the market returns quoted in this article reflect the market weighted average returns of stocks that currently trade on MY exchanges.
When trading stocks or any other investment, use the platform considered by many to be the Professional's Gateway to the Worlds Market, Interactive Brokers. You get the lowest-cost* trading on stocks, options, futures, forex, bonds and funds worldwide from a single integrated account. Promoted
Valuation is complex, but we're here to simplify it.
Discover if BCM Alliance Berhad might be undervalued or overvalued with our detailed analysis, featuring fair value estimates, potential risks, dividends, insider trades, and its financial condition.
Access Free AnalysisThis article by Simply Wall St is general in nature. It does not constitute a recommendation to buy or sell any stock, and does not take account of your objectives, or your financial situation. We aim to bring you long-term focused analysis driven by fundamental data. Note that our analysis may not factor in the latest price-sensitive company announcements or qualitative material. Simply Wall St has no position in any stocks mentioned.
*Interactive Brokers Rated Lowest Cost Broker by StockBrokers.com Annual Online Review 2020
Have feedback on this article? Concerned about the content? Get in touch with us directly. Alternatively, email editorial-team (at) simplywallst.com.
About KLSE:BCMALL
BCM Alliance Berhad
An investment holding company, distributes commercial laundry equipment, medical devices, and healthcare products in Malaysia and internationally.
Flawless balance sheet with low risk.
Market Insights

Advertisement
Community Narratives
Finding The True Value Of A Logistics Powerhouse
Fair Value US$95.21|8.4% undervalued
NV
Community Contributor
Paradigm Biopharmaceuticals Will Lead Osteoarthritis Treatment with Zilosul's FDA Success
Fair Value AU$5.50|92.1% undervalued
AM
Community Contributor
Barrick Mining (ABX:CA): A Gold Hedge against a U.S. Shutdown
Fair Value CA$60.00|24.2% undervalued
GM
Community Contributor