Megacable Holdings S. A. B. de C. V (BMV:MEGACPO) earnings and shareholder returns have been trending downwards for the last five years, but the stock advances 3.7% this past week


For many, the main point of investing is to generate higher returns than the overall market. But the main game is to find enough winners to more than offset the losers So we wouldn't blame long term Megacable Holdings, S. A. B. de C. V. (BMV:MEGACPO) shareholders for doubting their decision to hold, with the stock down 48% over a half decade.
While the last five years has been tough for Megacable Holdings S. A. B. de C. V shareholders, this past week has shown signs of promise. So let's look at the longer term fundamentals and see if they've been the driver of the negative returns.
View our latest analysis for Megacable Holdings S. A. B. de C. V
While markets are a powerful pricing mechanism, share prices reflect investor sentiment, not just underlying business performance. One flawed but reasonable way to assess how sentiment around a company has changed is to compare the earnings per share (EPS) with the share price.
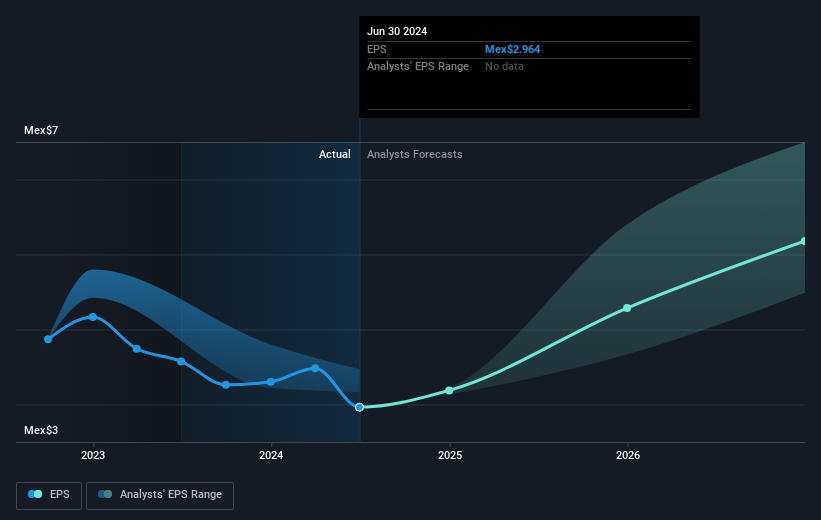
During the five years over which the share price declined, Megacable Holdings S. A. B. de C. V's earnings per share (EPS) dropped by 11% each year. This change in EPS is reasonably close to the 12% average annual decrease in the share price. That suggests that the market sentiment around the company hasn't changed much over that time. Rather, the share price change has reflected changes in earnings per share.
The company's earnings per share (over time) is depicted in the image below (click to see the exact numbers).
Before buying or selling a stock, we always recommend a close examination of historic growth trends, available here.
What About Dividends?
When looking at investment returns, it is important to consider the difference between total shareholder return (TSR) and share price return. The TSR is a return calculation that accounts for the value of cash dividends (assuming that any dividend received was reinvested) and the calculated value of any discounted capital raisings and spin-offs. It's fair to say that the TSR gives a more complete picture for stocks that pay a dividend. In the case of Megacable Holdings S. A. B. de C. V, it has a TSR of -34% for the last 5 years. That exceeds its share price return that we previously mentioned. This is largely a result of its dividend payments!
A Different Perspective
We're pleased to report that Megacable Holdings S. A. B. de C. V shareholders have received a total shareholder return of 13% over one year. And that does include the dividend. There's no doubt those recent returns are much better than the TSR loss of 6% per year over five years. We generally put more weight on the long term performance over the short term, but the recent improvement could hint at a (positive) inflection point within the business. It's always interesting to track share price performance over the longer term. But to understand Megacable Holdings S. A. B. de C. V better, we need to consider many other factors. Case in point: We've spotted 2 warning signs for Megacable Holdings S. A. B. de C. V you should be aware of.
Of course Megacable Holdings S. A. B. de C. V may not be the best stock to buy. So you may wish to see this free collection of growth stocks.
Please note, the market returns quoted in this article reflect the market weighted average returns of stocks that currently trade on Mexican exchanges.
New: Manage All Your Stock Portfolios in One Place
We've created the ultimate portfolio companion for stock investors, and it's free.
• Connect an unlimited number of Portfolios and see your total in one currency
• Be alerted to new Warning Signs or Risks via email or mobile
• Track the Fair Value of your stocks
Have feedback on this article? Concerned about the content? Get in touch with us directly. Alternatively, email editorial-team (at) simplywallst.com.
This article by Simply Wall St is general in nature. We provide commentary based on historical data and analyst forecasts only using an unbiased methodology and our articles are not intended to be financial advice. It does not constitute a recommendation to buy or sell any stock, and does not take account of your objectives, or your financial situation. We aim to bring you long-term focused analysis driven by fundamental data. Note that our analysis may not factor in the latest price-sensitive company announcements or qualitative material. Simply Wall St has no position in any stocks mentioned.
About BMV:MEGA CPO
Megacable Holdings S. A. B. de C. V
Engages in the installation, operation, and maintenance of cable television, internet, and telephone signal distribution systems.
Good value with reasonable growth potential.

