Stock Analysis
Quálitas Controladora. de (BMV:Q) stock performs better than its underlying earnings growth over last five years


We think all investors should try to buy and hold high quality multi-year winners. And highest quality companies can see their share prices grow by huge amounts. For example, the Quálitas Controladora, S.A.B. de C.V. (BMV:Q) share price is up a whopping 327% in the last half decade, a handsome return for long term holders. This just goes to show the value creation that some businesses can achieve. Also pleasing for shareholders was the 23% gain in the last three months.
Since the stock has added Mex$2.4b to its market cap in the past week alone, let's see if underlying performance has been driving long-term returns.
View our latest analysis for Quálitas Controladora. de
In his essay The Superinvestors of Graham-and-Doddsville Warren Buffett described how share prices do not always rationally reflect the value of a business. By comparing earnings per share (EPS) and share price changes over time, we can get a feel for how investor attitudes to a company have morphed over time.
During five years of share price growth, Quálitas Controladora. de achieved compound earnings per share (EPS) growth of 12% per year. This EPS growth is slower than the share price growth of 34% per year, over the same period. So it's fair to assume the market has a higher opinion of the business than it did five years ago. And that's hardly shocking given the track record of growth.
The company's earnings per share (over time) is depicted in the image below (click to see the exact numbers).
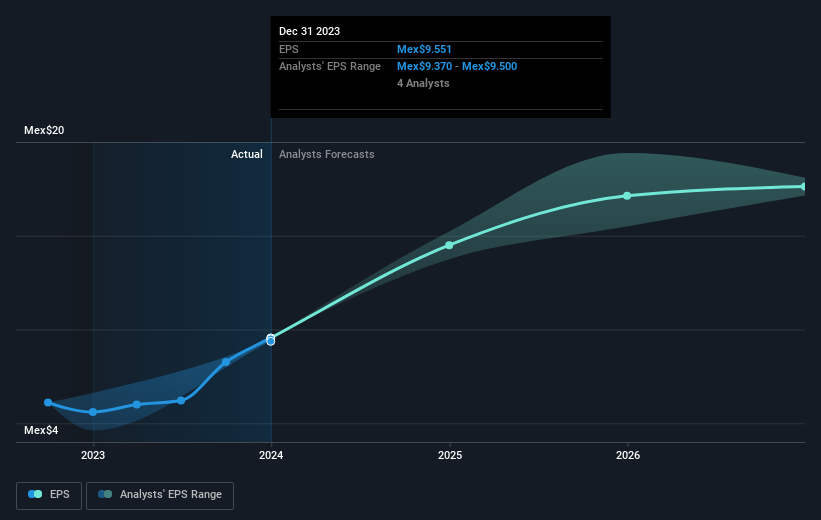
We know that Quálitas Controladora. de has improved its bottom line lately, but is it going to grow revenue? Check if analysts think Quálitas Controladora. de will grow revenue in the future.
What About Dividends?
When looking at investment returns, it is important to consider the difference between total shareholder return (TSR) and share price return. The TSR incorporates the value of any spin-offs or discounted capital raisings, along with any dividends, based on the assumption that the dividends are reinvested. So for companies that pay a generous dividend, the TSR is often a lot higher than the share price return. We note that for Quálitas Controladora. de the TSR over the last 5 years was 410%, which is better than the share price return mentioned above. This is largely a result of its dividend payments!
A Different Perspective
It's nice to see that Quálitas Controladora. de shareholders have received a total shareholder return of 77% over the last year. That's including the dividend. That's better than the annualised return of 39% over half a decade, implying that the company is doing better recently. In the best case scenario, this may hint at some real business momentum, implying that now could be a great time to delve deeper. While it is well worth considering the different impacts that market conditions can have on the share price, there are other factors that are even more important. Consider for instance, the ever-present spectre of investment risk. We've identified 1 warning sign with Quálitas Controladora. de , and understanding them should be part of your investment process.
Of course Quálitas Controladora. de may not be the best stock to buy. So you may wish to see this free collection of growth stocks.
Please note, the market returns quoted in this article reflect the market weighted average returns of stocks that currently trade on Mexican exchanges.
Valuation is complex, but we're helping make it simple.
Find out whether Quálitas Controladora. de is potentially over or undervalued by checking out our comprehensive analysis, which includes fair value estimates, risks and warnings, dividends, insider transactions and financial health.
View the Free AnalysisHave feedback on this article? Concerned about the content? Get in touch with us directly. Alternatively, email editorial-team (at) simplywallst.com.
This article by Simply Wall St is general in nature. We provide commentary based on historical data and analyst forecasts only using an unbiased methodology and our articles are not intended to be financial advice. It does not constitute a recommendation to buy or sell any stock, and does not take account of your objectives, or your financial situation. We aim to bring you long-term focused analysis driven by fundamental data. Note that our analysis may not factor in the latest price-sensitive company announcements or qualitative material. Simply Wall St has no position in any stocks mentioned.
About BMV:Q *
Quálitas Controladora. de
Quálitas Controladora, S.A.B. de C.V., together with its subsidiaries, operates as an auto insurance company in Mexico, El Salvador, Costa Rica, Peru, and the United States.
Excellent balance sheet with reasonable growth potential.
